# Shuttle
This file contains the full content of all blog posts and pages from https://www.shuttle.dev/
---
# Claude Agent Skills: What They Are and How to Build and Use One - Complete Guide
Source: https://www.shuttle.dev/blog/2025/12/02/claude-skills-complete-guide
Date: 2 December 2025
Author: dcodes
Tags: claude, ai, skills, shuttle, rust, deployment
A practical guide to Claude's Agent Skills, reusable knowledge packages that activate automatically across all your conversations. We'll build a custom Shuttle deployment skill and put it to work.
Anthropic recently released [Claude Agent Skills](https://www.claude.com/blog/skills), and there's been a lot of confusion around what they actually are. I was confused at first too. At first glance it looks like we already have a way to do what Skills do. We already have `CLAUDE.md` files, MCP servers, and custom commands that help AI agents work the way we want them to.
Unlike traditional AI assistants that require constant re-prompting, Claude skills let you upload specialized expertise or knowledge once and have it activate automatically whenever it's relevant. Your prompts become portable across conversations and projects, a significant improvement for software development workflows.
In this blog post, I'll explain what Claude skills are, how they differ from existing features, and then we'll build a practical one together: a Shuttle deployment skill that helps Claude scaffold and deploy Rust projects correctly.
## What Are Claude Skills?
Skills are folders containing a `SKILL.md` file that can include three types of content:
- **Instructions**: Guidelines, best practices, and conventions Claude should follow
- **Scripts**: Executable Python or bash code Claude can run as part of workflows
- **Resources**: Reference documentation, templates, and examples Claude can pull from
When you start a conversation, Claude loads the headers and descriptions of your available skills into context. This doesn't take much space. The full content only gets pulled in when Claude detects something relevant to your task.
This is the key insight that makes Skills different from just dumping a bunch of context into your conversation. Context bloat is a real problem in agentic coding. We talked about this in more detail in the [Claude Code Best Practices](https://www.shuttle.dev/blog/2025/10/16/claude-code-best-practices) post. Every instruction, every piece of documentation, every tool definition sits in your context window whether you use it or not. MCPs and other external tools have this problem: their tool definitions consume tokens from the moment you enable them, increasing token usage even when you don't need them.
Skills solve this by being lazy. Headers only until needed. Full content on demand. This approach helps the agent's ability to maintain context over long conversations without running into limits.
Anthropic describes Skills as having four core properties:
- **Composable**: Skills stack together, and Claude identifies which ones are needed and coordinates their use automatically.
- **Portable**: Same format everywhere. Build once, use across Claude.ai, Claude Code, and the API.
- **Efficient**: Only loads what's needed, when it's needed.
- **Powerful**: Can include executable code for tasks where traditional programming is more reliable than token generation.
### Composable
You don't have to pick one skill per conversation. Say you're tackling complex tasks like building a full-stack app with a Shuttle backend, SQLx for database operations, and a Svelte frontend. Claude can activate multiple AI agents' worth of knowledge simultaneously. The Shuttle skill handles deployment patterns and resource annotations, the SQLx skill ensures your queries use compile-time verification correctly, and the Svelte skill keeps your components following best practices.
Each skill handles its domain, and Claude coordinates between them. You build small, focused skills and let them work together.
### Portable
Most of us developers work on multiple projects simultaneously, and repetitive tasks like re-configuring your agent for each project gets tedious fast. Writing a slash command for one project and then manually copying it to another is exactly the kind of routine task that should be automated. Skills solve this. Think of them like npm packages or Rust crates, but for Claude knowledge. Write once, use everywhere. The same `SKILL.md` file works in Claude.ai's web interface, Claude Code in your terminal, and the API.
### Efficient
Traditional approaches to customization load everything upfront. Skills take the opposite approach: only headers and descriptions load initially, which takes minimal context. Full content loads when Claude detects relevance. Ten installed skills don't mean ten skills worth of context consumption.
### Powerful
Sometimes you don't want Claude generating code. You want it running deterministic scripts that do exactly what you need. Skills can include specialized tools in the form of Python and bash scripts that Claude can execute for specific tasks, giving you a hybrid of AI flexibility and programmatic precision.
## Claude Skills vs AI Agents and AI Assistants
If you've been using Claude or other AI agents for a while, you might be wondering how Skills differ from the other ways to customize agent behavior. Here's the breakdown:
**Custom Instructions** (in Claude.ai web) are tied to your account settings. They apply globally but can't include resources, scripts, or structured documentation. They're also limited in length.
**Projects** (in Claude.ai web) give you a dedicated space with custom instructions and uploaded files, but you have to be in that specific project to use them. If you want the same behavior across multiple projects, you're copying and pasting.
**Slash Commands** (in Claude Code) let you trigger specific behaviors with `/command`, but they require explicit invocation. You have to remember to use them.
**Skills** are universal and automatic. You install them once, and Claude activates them based on context. You don't need to be in a specific project. You don't need to remember a command. You just start working, and if your task matches a skill, Claude uses it.
The token usage angle matters too. With Projects or custom instructions, everything loads into context at the start. With Skills, only the headers and descriptions load initially. If you have ten skills installed but only need two for a given conversation, you're not paying the context cost for the other eight.
## Building a Shuttle Skill
I hope the explanation above gave you some insight into what Skills are and how they differ from existing features.
Now, let's build something practical. Shuttle has its own Rust macros, configuration format, and deployment patterns. Claude doesn't always get these right out of the box - it might use outdated syntax, miss resource annotations, or structure the project incorrectly.
A Shuttle skill solves this by giving Claude the exact patterns it needs. When you ask Claude to build or deploy a Shuttle project, the skill activates and provides correct context.
### Skill Folder Structure
Before we dive into building, let's understand how skills are organized. A skill is simply a folder with a specific structure:
```text
my-skill/
├── SKILL.md (required)
├── reference.md (optional documentation)
├── examples.md (optional examples)
├── scripts/
│ └── helper.py (optional utility)
└── templates/
└── template.txt (optional template)
```
The only required file is `SKILL.md` - it's the entry point that defines your skill's name, description, and core instructions. Everything else is optional and loaded on-demand. You can add reference documentation, code examples, Python or bash scripts, and templates as needed. Claude will have access to all files in the skill folder, but it only loads them when the conversation actually requires that information.
From within `SKILL.md`, you can link to other files in your skill folder. When Claude needs more details, it follows these references automatically:
````markdown
Check [examples.md](examples.md) for complete code samples.
To format the output, run:
```bash
python scripts/formatter.py --input data.json
```
````
This progressive loading is where the efficiency comes in. Your skill can include detailed API documentation, complex examples, and utility scripts, but Claude only reads them when the conversation actually needs that information. Comprehensive skills don't mean bloated context.
### The Skill Creator Skill
Claude.ai already has a skill for creating skills. The `skill-creator` skill comes built-in, and it contains all the knowledge about how to write effective `SKILL.md` files, structure skill folders, and follow best practices.
This means you can literally tell Claude "create a skill for X" and it will load the skill-creator skill and use that knowledge to build your new skill. A skill that creates skills.
To make sure it's enabled, go to Settings → Capabilities and verify that `skill-creator` is turned on:
Once enabled, you can ask Claude to create any skill you need, and it'll handle the entire process - from structuring the folder to writing the `SKILL.md` content with proper headers, activation patterns, and instructions.
### Creating the Shuttle Skill
Let's put the skill-creator to work. I gave Claude a simple prompt: "Create a skill for the Shuttle Rust hosting platform."
Claude loads the `skill-creator` skill and starts reading its content to understand how to build a proper skill:
Then it gets to work, creating the skill structure and gathering context about Shuttle's patterns:
The first version was functional but verbose. I gave it more comprehensive knowledge about Shuttle's macros, resource annotations, and configuration format, then asked it to make the content more concise. The `skill-creator` helped refine it into something practical:
The result is a focused skill that covers the essential patterns developers need when working with Shuttle - proper macro usage, resource provisioning, and project configuration:
The skill now knows about `#[shuttle_runtime::main]`, how to use database macros like `#[shuttle_shared_db::Postgres]`, and the correct `Shuttle.toml` configuration format. When I ask Claude to scaffold or deploy a Shuttle project, it'll activate this skill and use these patterns automatically.
You can press the Download button to get the skill as a zip file, then load it into Claude Code or any other Claude interface.
> Skills can be created directly in Claude Code too, but I used Claude.ai for this because the built-in skill-creator makes the process more guided. In Claude Code, you'd manually create the folder structure and write the `SKILL.md` file yourself.
### Installing the Skill
After downloading the skill, I created a project directory and unzipped it. The skill extracted into a clean structure:
The `shuttle` skill that Claude created includes (you can add more files according to your needs):
- `SKILL.md` - The main skill file with activation patterns and core instructions
- `references/framework_examples.md` - Code examples for different web frameworks (Axum, Actix, Rocket)
- `references/custom_resources.md` - Documentation on Shuttle's resource provisioning system
This modular structure means Claude only loads the framework examples or custom resources documentation when the conversation actually needs them. The base `SKILL.md` provides the core patterns, and the reference files add depth on demand.
To install it, move the unzipped folder to `.claude/skills/`. In my case, I placed it at `.claude/skills/shuttle`.
Once the skill is in the right location, Claude Code detects it automatically:
- `~/.claude/skills/` - Personal skills, available globally across all projects
- `.claude/skills/` - Project skills, scoped to that specific project
## Using the Shuttle Skill
Let's see the skill in action. I started a new Claude Code session and gave it a straightforward prompt: "Use the Shuttle Skill to build a todo list app with a postgres database and sqlx and deploy to Shuttle."
In this case, I had to explicitly ask Claude to use the Shuttle skill. While skills are designed to activate automatically based on context, Claude doesn't always detect them on the first try and it's actually a bit conservative by default. Sometimes you need to be explicit about which skill to use.
When you reference a skill, Claude Code asks for permission to read it:
These permission prompts are part of the security measures built into Claude Code. The agent won't read files or execute scripts without your approval. After accepting, Claude has full context on how to use Shuttle: the correct macros, resource annotations, project structure, and deployment patterns.
Claude breaks down the task into clear steps, from setting up dependencies and migrations to implementing CRUD endpoints and deploying. Each step follows the patterns from the skill.
After the build succeeded, Claude deployed the application to Shuttle:
## Conclusion
Skills are what turn Claude into one of the more sophisticated AI agents available today. Instead of dumping everything into your conversation upfront or manually triggering commands, you get knowledge that activates when relevant and stays quiet when it's not.
The Shuttle skill we built is a good example of where this shines. Deployment patterns, macro syntax, and resource annotations are things you need exactly when you need them, not cluttering every conversation. Build skills for your common workflows, your team's conventions, and your favorite frameworks. They stack, they're portable, and they don't bloat your context.
If you want to try Shuttle yourself, you can get started with:
```bash
shuttle init --template axum
```
Download the Shuttle skill and install it in your Claude Code or Claude.ai account to get started.
Happy building!
---
# Building a Full-Stack Rust Web App with Claude Opus 4.5
Source: https://www.shuttle.dev/blog/2025/11/26/build-rust-app-claude-opus-4.5
Date: 26 November 2025
Author: dcodes
Tags: rust, claude, ai, axum, sqlx, postgres, full-stack
Testing Claude Opus 4.5's coding abilities by building a complete production-ready Rust web application with database, frontend, and deployment - all from a single prompt
Last week Google released Gemini 3, and it really killed the competition. It only took a week for Anthropic to respond with Claude Opus 4.5, beating Gemini 3 on SWE-bench Verified and not letting Google take over the top spot for too long.
Benchmarks are useful, but what matters more is real-world performance. In this post, I'll test Claude Opus 4.5 by building a production-ready Rust web application with database, frontend, and deployment - all from a single prompt, letting the AI agent handle the entire process.
## Claude Opus 4.5
Anthropic just released Claude Opus 4.5, and according to benchmarks, claims, and community response, it's a genuine leap forward for coding with AI. It's now the best model in the world for software engineering, scoring 80.9% on SWE-bench Verified - outperforming every other frontier model including GPT-5.1 and Gemini 3 Pro. According to Anthropic, Claude Opus 4.5 outperformed every human candidate on their notoriously difficult performance engineering take-home exam.
The improvements are across the board: better reasoning under ambiguity, creative problem-solving, and state-of-the-art performance in most domains. Claude Opus 4.5 also uses dramatically fewer tokens to reach better outcomes than its predecessors.
I gave Claude Opus 4.5 a task: build a full-stack Rust web application from scratch, complete with database migrations, frontend assets, and deploy it to Shuttle. One comprehensive prompt, no follow-up corrections.
The application is a personal finance tracker with transaction management, budget tracking, spending insights with charts, and a modern UI. The stack uses Rust with Axum and SQLx for the backend, PostgreSQL for the database, and vanilla HTML/CSS/JS for the frontend.
The requirements are using SQLx compile-time checked query macros throughout (no raw queries), proper database migrations, a clean modern UI, and everything deployed to Shuttle with the database provisioned automatically.
## The Prompt
Here's the complete prompt I used:
```markdown
Build a Personal Finance Tracker web application with the following requirements:
**Backend (Rust + Axum + SQLx):**
- Use Rust with the Axum web framework
- Use SQLx for database operations with PostgreSQL
- Use SQLx compile-time checked query macros (query!, query_as!, etc.) throughout - no raw queries
- Database is running on localhost:5432
- Create proper database migrations using `sqlx migrate add` commands
- Implement migrations to create necessary tables (transactions, categories, budgets, etc.)
- Run migrations automatically or provide clear instructions
- Before deployment, run `cargo sqlx prepare` to generate query metadata for offline compilation
- Create RESTful API endpoints for:
- Adding/editing/deleting transactions
- Categorizing transactions
- Getting spending summaries by category/time period
- Budget management
**Frontend (HTML/CSS/JS):**
- Create a modern, clean, and slick UI using vanilla HTML, CSS, and JavaScript
- Make it responsive and mobile-friendly
- Include data visualizations (charts for spending by category, trends over time)
- Use a nice color scheme and contemporary design patterns
- Place all frontend assets in a `dist/` directory
**Deployment:**
- Deploy to Shuttle
- Configure the Shuttle.toml to include frontend assets
- Use the Shuttle MCP server to handle the deployment
- You can also use the Shuttle MCP server to search Shuttle documentation if needed
**Features to implement:**
- Transaction management (add, edit, delete income/expenses)
- Automatic and manual categorization
- Budget setting and tracking
- Spending insights with charts (pie charts, bar charts, line graphs)
- Date range filtering
- Summary statistics (total spent, by category, monthly trends)
Build this as a complete, production-ready application with proper error handling, validation, and a polished user experience.
```
This tests a lot of things: Rust idioms, database design, API design, frontend skills, and platform-specific deployment knowledge.
## Setting Up the Test
I started with a fresh Shuttle Axum project to give Claude Opus 4.5 a clean slate:
```bash
shuttle init --template axum
```
For this experiment, I used Cursor with Claude Opus 4.5 through the Agent feature. I pasted the entire prompt into the Agent view and hit enter.
## Watching It Work
Before writing any code, just like other frontier models, Claude Opus 4.5 started by collecting context. One of its first actions was using the Shuttle MCP server's documentation search tool to understand how Shuttle works, what features are available, and how to structure the deployment configuration.
This is smart behavior, it gives it a good understanding of the platform, it verified current best practices and platform capabilities.
> **My problem** with other frontier models was that even though they'd look up the documentation, they'd still make the mistake of using outdated dependencies and syntax, especially with Axum.
Within seconds of finishing its research, it started generating code. It worked through the requirements - setting up the database schema, creating migrations, building out API endpoints, and crafting the frontend.
In just a few minutes, it had written over 2,500 lines of code across multiple files. The agent view showed it was now attempting to build the project.
What impressed me most wasn't just the speed - it was the attention to detail. I was specifically watching for common mistakes that trip up other frontier models, particularly around Axum's routing syntax.
In Axum 0.8, the dynamic route syntax changed from `/:id` to `/{id}` (curly braces instead of colons). This is a subtle but breaking change that causes runtime errors. I've tested plenty of models on Axum projects, and they consistently get this wrong - even Claude Sonnet 4.5 makes this mistake.
Claude Opus 4.5 got it right. For me personally, this is a huge improvement over Sonnet 4.5 because this would always cause a runtime error - it's subtle but very important.
Every single route used the correct `/{id}` syntax. Claude Opus 4.5 also used the latest versions of all the crates - Axum, SQLx, tower-http, and everything else - without any prompting. This is something other frontier models consistently get wrong, often pulling outdated versions from their training data.
## The Build Process
Claude Opus 4.5 organized its work into a clear todo list, systematically checking off each step:
The dependencies it chose were spot-on - SQLx with the right features, serde for serialization, tower-http for serving static files, and all the other pieces needed for a production application.
After writing all the migrations, API handlers, and frontend code, it ran `cargo build`.
Before the successful compilation, running `cargo sqlx prepare` failed a few times. Claude Opus 4.5 caught the errors and corrected itself twice, adjusting the database queries and schema setup. It's impressive to see the best model debug its own work and iterate toward a solution without human intervention.
Once it worked through those issues, it compiled successfully.
The only correction I had to make was providing the local database password for running migrations. Claude Opus 4.5 generated the SQLx commands correctly, but since I hadn't specified my local PostgreSQL password in the prompt, it used a placeholder that needed updating.
That's it. One prompt, one password fix, and everything else worked perfectly.
Claude Opus 4.5 then moved on to deployment, using the Shuttle MCP server to deploy the application. It found the existing project ID and started the deployment process.
## The Result
A few minutes later, the deployment completed successfully:
The application was live at a production URL with everything I asked for:
- **Backend**: Axum with RESTful API, SQLx compile-time checked queries, proper error handling
- **Database**: PostgreSQL with three migrations (categories with seed data, transactions, budgets)
- **Frontend**: Dark-themed modern UI with Chart.js visualizations, responsive design, modal forms
The feature set was complete:
It implemented a full dashboard with stats cards and charts, complete transaction management with filtering, budget tracking with progress bars, analytics views, and eight pre-seeded categories with icons and colors. The API had all the endpoints needed for CRUD operations on transactions, budgets, and categories, plus analytics endpoints for summaries and trends.
## The Application in Action
The application was live. Let me show you what Claude Opus 4.5 built.
The dashboard greets you with a clean, modern dark theme. Stats cards show your financial overview - total income, expenses, and balance. Below that, a pie chart breaks down spending by category and a line chart tracks monthly trends.
The transactions page has all the functionality you'd expect - date range filters, category and type dropdowns, and a clean list of transactions with their icons and amounts. Each transaction can be edited or deleted.
Budget management: set budgets per category, and progress bars show how much you've spent versus your limit, with color coding to indicate status.
The analytics section provides deeper insights with bar charts comparing income vs expenses, pie charts for expense breakdowns, and horizontal bar charts showing top spending categories.
The entire UI is responsive, the charts are interactive, and everything works as you'd expect from a production application.
Adding a transaction brings up a polished modal with proper form controls - toggle buttons for income/expense, amount input, description field, category dropdown with icons, and a date picker. All of these are wired up to the Rust backend API.
Every button you see is functional. Add, edit, delete - they all make proper API calls to the Axum backend, which validates the data and updates the PostgreSQL database through SQLx's compile-time checked queries.
## Final Thoughts
Claude Opus 4.5 is the best coding model I've used, no doubt about it. One prompt built a complete full-stack application with a Rust backend, database migrations, a polished frontend, and deployment to production. All that without making any major mistakes or getting stuck.
Every crate dependency was current. The Axum routing syntax was correct. The SQLx queries used the right macros. The UI looks good. The deployment worked on the first try.
Claude Opus 4.5 is noticeably slower than Sonnet 4.5 - you'll wait longer for responses. But for complex coding tasks where accuracy matters more than speed, the wait is worth it. When you have the best model handling your code, I'd rather wait an extra minute for code that works than iterate multiple times fixing mistakes from a faster model.
The Shuttle MCP integration made deployment seamless. Claude Opus 4.5 used it to search documentation when needed and handled the entire deployment process autonomously.
## When to Use Claude Opus 4.5
Here's when Claude Opus 4.5 is the right tool for the job versus when you should reach for something faster:
| Use Claude Opus 4.5 For | Use Faster Models For |
| ----------------------------------------------- | ----------------------------------------- |
| Complex multi-file features | Small adjustments and quick fixes |
| System design and architecture decisions | Simple refactoring (renaming, formatting) |
| Building new applications from scratch | Documentation updates |
| Decision-making with multiple valid approaches | Adding comments or docstrings |
| Brainstorming and generating ideas | Tweaking CSS or UI styling |
| Implementing features that require deep context | Single-line bug fixes |
For the small, fast edits, I use Cursor's Composer - it's incredibly fast for those tasks. We covered why Composer excels at quick iterations in [this post](https://www.shuttle.dev/blog/2025/11/05/cursor-composer-hands-on?utm_source=shuttle_blog&utm_medium=blog&utm_campaign=opus_4_5_rust_app).
Refactoring is a gray area. For simple renames or extractions, Composer wins on speed. But for architectural refactoring where you're restructuring modules or changing patterns across multiple files, Claude Opus 4.5's deeper reasoning is worth the wait.
The pattern I've found works best: use Claude Opus 4.5 when accuracy and architectural decisions matter more than speed, and use Composer (or any other fast model) when you need rapid iteration on smaller changes.
## Try It Yourself
Want to build your own Rust web application? Get started with Shuttle (it's free):
```bash
shuttle init --template axum
```
Join the Discord to discuss Claude Opus 4.5 and share your thoughts on this model.
---
# Best AI Coding Assistant Tools For Developers (November 2025)
Source: https://www.shuttle.dev/blog/2025/11/20/ai-coding-tools-for-developers
Date: 20 November 2025
Author: dcodes
Tags: ai, coding, cursor, claude, github-copilot, development, tools, windsurf, gemini, openai
A comprehensive guide to choosing the right AI coding assistant for your workflow. Compare Cursor, Claude Code, GitHub Copilot, and more to find what actually fits how you work.
Remember when we had to actually remember all those API methods? Yeah, me neither - that was roughly 18 months ago in developer years, which is basically ancient history now.
AI coding assistants have evolved from fancy autocomplete into something genuinely useful, but the problem is that there are way too many options and it's difficult to choose the right one. Everyone has their own use case when it comes to coding - you might be a developer who wants to build complex enterprise features, or you might be a vibe coder who wants to quickly prototype ideas.
This article will help you choose the right AI coding assistant for your needs. We'll look at the most popular AI coding tools and explain each one and why they're important. We'll end the article with a quick decision matrix to help you choose the right tool specifically for your needs.
Before we dive in, this isn't an either/or assessment. You can use multiple tools together based on what each does best. Personally, I use Claude Code for extensive coding sessions, Cursor for its quick and intelligent autocomplete via Cursor Tab and its Composer model for quick tasks, and GitHub Copilot to get answers from public repositories. Each tool excels at different things, and combining them creates a more powerful workflow. It's also important to keep an eye out for new tools launching - the landscape is evolving quickly.
## What Makes a Good AI Coding Assistant?
Not all AI coding tools are created equal and not all of them are created for the same purpose. I evaluated these based on real developer challenges - the stuff that actually slows you down:
- **Debugging and error resolution** - Can it help you fix bugs, or does it just generate more?
- **Seamless integration** - Does it fit your workflow or force you to adapt?
- **Scalability and maintainability** - Does it help with refactoring large codebases?
- **Adapting to technology** - Can it work with new frameworks and libraries?
- **Security and vulnerability mitigation** - Does it introduce security holes?
- **Model access and flexibility** - Which AI models can you use? Can you switch between Claude, GPT, Gemini, and others? Different models excel at different tasks, so having choice matters. Tools that lock you into a single model limit your options when that model struggles with your specific use case.
These should be kept in mind when you're choosing the right tool for your needs. Let's get into the tools.
## The Tools Breakdown
### IDE-Based Tools
#### Cursor: AI-First Code Editor (Most Popular)
Cursor is a fork of VS Code that treats AI as a first-class citizen rather than a plugin afterthought. The native AI chat understands your entire codebase, and the multi-file editing works really well. Cursor can execute multiple tools at the same time, making code editing much faster and more efficient.
Cursor gives you access to all the major AI models: Claude Sonnet 4.5, GPT-5.1, [Gemini 3 Pro](https://www.shuttle.dev/blog/2025/11/18/gemini-3?utm_source=shuttle_blog&utm_medium=interlink&utm_campaign=ai_coding_tools), and their own Composer model. You can switch between models based on your needs, which is particularly useful when different models excel at different types of tasks.
Cursor also provides a feature called **Cursor Tab** which provides context-aware suggestions that understand relationships between files and an agent mode for agentic coding.
Cursor's **Composer** model is designed for speed and intelligence at the same time. The speed is impressive, but the good thing is that it doesn't compromise much on its intelligence. Personally, Composer is my favorite and most used model when it comes to easy to medium-level tasks.
Two standout features set Cursor apart:
**Parallel agent mode** lets you run the same task across multiple models simultaneously - Claude Sonnet 4.5, GPT-5.1, Gemini 3 Pro - then compare which one solved it better. This is particularly useful for complex tasks where you expect most models might fail on the first try. Running multiple agents in parallel increases your chances of getting at least one correct solution.
**Background agents** run in the cloud and create PRs against your repository when complete. This integrates with Linear - you can mention Cursor in Linear tickets to handle specific tasks in the background. Combined with Vercel's preview deployments, you can review the changes immediately without blocking your local work. This works really well for easy to medium tasks that don't require extensive debugging. We covered what we built with Cursor Composer in [our hands-on review](https://www.shuttle.dev/blog/2025/11/05/cursor-composer-hands-on?utm_source=shuttle_blog&utm_medium=interlink&utm_campaign=ai_coding_tools).
Cursor recently released version 2.0 with significant changes to the agent system and UI. Read more about [what changed in Cursor 2.0](https://www.shuttle.dev/blog/2025/10/31/cursor-2.0?utm_source=shuttle_blog&utm_medium=interlink&utm_campaign=ai_coding_tools).
**Best for:** Heavy coders and developers who want AI baked into their editor from the ground up. It's also great for vibe coders who want to only use natural language to code.
#### Windsurf (formerly Codeium): AI-First Code Editor
Windsurf is similar to Cursor in approach - it's a VS Code fork with AI as a first-class citizen rather than an afterthought. The AI chat understands your entire codebase, and it provides context-aware suggestions with multi-file editing capabilities.
After some industry drama where Anthropic cut Claude access following OpenAI's acquisition of Windsurf, the platform now primarily uses GPT-5.1 as the default model. You can bring your own API key to access Claude 4 models, and Windsurf also offers Gemini 3 Pro and their own base model built on Llama 3.1 70B.
The agent system handles coordinated changes across files, making it solid for refactoring and feature development. While Cursor has more market share, Windsurf delivers comparable AI assistance.
**Best for:** Heavy coders and developers who want AI baked into their editor from the ground up. Great for vibe coders who want to use natural language to code.
#### GitHub Copilot: The Industry Standard
GitHub Copilot is the tool that started the AI coding assistant wave. It excels at autocomplete and has deep GitHub integration - pull request summaries, code review suggestions, and repo-wide code understanding. It also gives you access to cutting-edge models like OpenAI's latest releases.
It integrates seamlessly into VSCode as an extension, making it incredibly easy to get started. The suggestion quality is consistently good, and the GitHub integration provides PR summaries and code review assistance. Multi-line completions work well for boilerplate.
One particularly useful feature I use constantly is the codebase chat. While Copilot works as a plugin in your IDE, you can also use it directly on the GitHub website. When I'm looking at any repository on GitHub, I click the Copilot icon and chat about the codebase without cloning it locally. I find this incredibly useful for understanding libraries, frameworks, or open source projects I'm unfamiliar with - especially ones with poor or outdated documentation.
The free tier is generous enough that you can use this feature extensively without paying. I find myself using this constantly when exploring codebases that aren't mine and I have no context about them. Given the free tier and easy VSCode integration, I highly recommend trying Copilot - it's a great starting point for AI-assisted coding.
**Best for:** Teams already using GitHub who want reliable autocomplete and PR integration. Also excellent for quickly understanding unfamiliar codebases directly on GitHub.
#### Kiro by AWS: Spec-Driven Development
Kiro flips the usual flow: instead of jumping straight to code, it generates detailed requirements documents first. You review and approve the spec, then Kiro generates implementation.
The platform offers free access to Claude Sonnet 4.5 and 3.7 models during public preview. You can choose between Claude Sonnet 4.5 for advanced coding or use Auto mode, which mixes frontier models to balance quality, latency, and cost.
This approach catches architectural issues before you write code. It's particularly useful for complex features where requirements need clarity before implementation. The downside is that this can be painfully slow sometimes and feels like overkill for most projects. But for enterprise and production applications where getting the architecture right matters, this is really good.
**Best for:** Enterprise developers in the AWS ecosystem who want to validate requirements before implementation. Skip this if you're prototyping or building personal projects - the spec-driven approach will slow you down unnecessarily.
#### Google Antigravity: Agent-First IDE
Antigravity is Google's new agentic development platform. It offers a dual interface: an Editor view (traditional AI-powered IDE) and an agent-first Manager view where you can spawn and orchestrate multiple agents across workspaces in parallel.
Released alongside [Gemini 3](https://www.shuttle.dev/blog/2025/11/18/gemini-3?utm_source=shuttle_blog&utm_medium=interlink&utm_campaign=ai_coding_tools) and available in public preview at no charge. It's designed for the next era of autonomous coding where agents can work asynchronously across multiple surfaces.
What sets Antigravity apart is its multi-model approach. You get access to Gemini 3 Pro with generous rate limits, plus Claude Sonnet 4.5 and GPT-OSS. This cross-platform model access lets you leverage different models' strengths within a single platform.
The agent system generates artifacts (task lists, implementation plans, walkthroughs, screenshots, browser recordings) to help you verify its work. It's built around four tenets: trust, autonomy, feedback, and self-improvement. The feedback system lets you comment on artifacts Google-doc-style, and the agent learns from past work through a knowledge base.
Currently available as a free public preview for MacOS, Windows, and Linux.
**Best for:** Developers who want truly autonomous agents that can work across multiple surfaces (editor, terminal, browser) and handle complex end-to-end tasks asynchronously.
### Browser-Based Tools
#### Lovable: Full-Stack App Builder
Lovable lets you build full-stack applications entirely in the browser. You describe what you want, it generates the code, and you can iterate immediately with a live preview.
Lovable switched to Claude 4 platform-wide, delivering approximately 25% fewer errors and 40% faster prompt execution. The team chose Claude after evaluating commercial and open-source models because it performed best at generating production-ready code. The platform builds full-stack apps with React, Tailwind, Vite on the frontend and connects to Supabase for backend and database.
The browser-native development means no local setup. The company has grown to 2.3 million monthly active users and 180,000 paying subscribers with this approach.
**Best for:** Rapid prototyping and MVPs when you want to validate ideas quickly.
#### Bolt: Prompt-To-App Generation
Bolt (from StackBlitz) takes natural language prompts and generates full-stack applications. Like Lovable, it's browser-based, but with stronger focus on framework flexibility - it can generate Next.js, Remix, or vanilla setups.
Bolt partnered with Anthropic and now provides Claude Sonnet 4 to all users. Claude 3.5 Sonnet was described by StackBlitz as "the enabling technology that made this product possible" for Bolt. Within four weeks of launching with Claude, Bolt went from zero to $4 million in ARR.
The generated code is surprisingly production-ready. It handles routing, state management, and API integration. You can download the code and continue locally.
**Best for:** Quick MVPs and demos when you need to ship something functional fast.
#### v0: AI-Powered UI Generator
v0 (previously v0.dev, now v0.app) is Vercel's AI builder that generates React code using shadcn/ui and Tailwind CSS. You describe the UI you want - like "a pricing section with three plans" - and v0 instantly generates clean, editable code.
The platform evolved beyond simple UI generation into a full agentic system. It can research, debug, plan, conduct web searches, read files, inspect sites, and manage tasks. Vercel uses a composite approach: retrieval to ground the model, a frontier LLM for reasoning, and a streaming post-processor called "AutoFix" that catches errors during generation.
Founders use v0 for everything from pitch decks to live MVPs, including landing pages, onboarding flows, dashboards, and data capture. The Platform API lets you build your own AI app builders on top of v0's code generation.
**Best for:** UI-first development and Next.js applications when you want production-quality components.
#### Convex Chef: Full-Stack App Builder
Convex Chef builds complete full-stack applications with proper backend infrastructure. Unlike other AI builders that focus mainly on UI, Chef generates both frontend and backend using Convex's TypeScript APIs.
You get a complete stack: database, auth, file storage, and background workflows. The platform supports multiple AI providers including GPT-4, Claude, and Gemini, plus a built-in OpenAI proxy for AI app prototyping.
Chef is fully open source under Apache 2.0. Over 250,000 people have used it to create full-stack projects. Available locally or at chef.convex.dev.
**Best for:** Applications that need real backend functionality - databases, authentication, file uploads, and background jobs without manual setup.
#### Replit: Interactive Coding Platform
Replit combines an online IDE with AI assistance and real-time collaboration. You can pair program with teammates or with the AI, and everything runs in the browser.
Replit Agent v2 (in early access) is powered by Claude 3.7 Sonnet and was rebuilt from the ground up for better autonomy and debugging. It features real-time app design preview that renders interfaces as they're being built - an industry first. The agent forms hypotheses, searches for the right files, and only makes changes when it has enough context.
The platform also includes Replit Assistant for code completion, debugging, refactoring, and explanations across most languages and frameworks. Real-time collaboration works like Google Docs for code - multiple people can work in the same project simultaneously. Over 500,000 businesses use Replit for collaboration and prototyping.
**Best for:** Real-time collaboration, rapid prototyping, and teaching or learning to code with AI assistance.
### Terminal & CLI Tools
#### Claude Code: Natural Language Terminal Assistant
Claude Code brings conversational AI to your terminal. It understands your file system, can execute multi-step tasks, and maintains context across commands.
Claude Code uses Claude Sonnet 4.5 as the default model, with access to Claude Opus 4.1 and Claude Haiku 4.5. All of these are Anthropic's latest models, giving you access to some of the best reasoning and coding capabilities available.
You can ask it to debug issues, refactor code, set up projects, or explain what code does. It has full file system awareness and can execute bash commands, edit files, and manage git operations. Check out our [best practices guide for Claude Code](https://www.shuttle.dev/blog/2025/10/16/claude-code-best-practices?utm_source=shuttle_blog&utm_medium=interlink&utm_campaign=ai_coding_tools) to get the most out of it.
**Best for:** Heavy coders who live in the terminal and want natural language control powered by Claude Sonnet 4.5, the leading coding model available today.
#### Warp: AI-Powered Terminal
Warp reimagines the terminal with a block-based UI where each command and output is a discrete block. The AI can suggest commands, explain errors, and help you build complex command chains.
Warp supports multiple AI models including GPT-5, GPT-4o, Claude 3.5 Sonnet and Haiku, Claude 4.x models, and Gemini 2.5. Free users get limited access to advanced models like Claude 4.x, while premium Lightspeed subscribers get unlimited access to the latest models from OpenAI, Anthropic, and Google. You can switch between models by clicking the displayed model name to access a dropdown with all available options.
The command palette learns your patterns and suggests relevant commands. The block-based interface makes it easier to reference previous outputs and build command sequences.
**Best for:** Terminal power users who want command suggestions and better terminal UX.
#### Gemini CLI: Google's Terminal Agent
Google's CLI agent leverages the 1M token context window for deep codebase understanding. You can point it at large codebases and ask architectural questions.
Gemini CLI is free and open-source. When you log in with a personal Google account, you get free access to Gemini 2.5 Pro. Google AI Ultra subscribers and paid API users can access Gemini 3 Pro, Google's most intelligent model with state-of-the-art reasoning capabilities.
The massive context window means it can analyze entire projects without losing track. It's particularly good for navigating unfamiliar large codebases and understanding system architecture.
**Best for:** Heavy coders navigating and understanding large codebases with many files.
### Open Source & Models
#### OpenAI Codex: ChatGPT-Powered CLI
Codex is OpenAI's answer to Claude Code - a CLI agent for software development tasks, powered by GPT-5 models. It works directly in your terminal and integrates with your IDE through extensions.
The tool can edit code, run commands, and handle multi-file changes. It supports the Agent Client Protocol (ACP) for seamless IDE integration and offers an SDK for embedding into custom workflows.
Available through API key, ChatGPT subscriptions, or GitHub Copilot integration. The CLI supports state-of-the-art code generation with the GPT-5.1-Codex family of models.
**Best for:** Developers wanting OpenAI's latest models integrated into their command-line workflow.
#### Kimi CLI: Open-Source Agent Tool
Kimi CLI is an open-source command-line agent from Moonshot AI. It handles coding tasks, file management, and terminal operations with a 128K token context window suitable for large codebases.
The tool operates in dual modes - you can switch between agent mode and shell mode with Ctrl-X. It supports the Agent Client Protocol for IDE integration and is built on the Model Context Protocol (MCP) for interoperability.
Powered by the Kimi K2 Thinking model, which achieves competitive performance on coding benchmarks (71.3% on SWE-Bench Verified, 83.1% on LiveCodeBench V6). K2 competes with models like Claude Sonnet 4.5 at a fraction of the cost. We tested K2 extensively in [our hands-on review](https://www.shuttle.dev/blog/2025/11/17/kimi-k2-thinking-hands-on-review?utm_source=shuttle_blog&utm_medium=interlink&utm_campaign=ai_coding_tools) and found it to be a really good open-source alternative.
**Best for:** Developers wanting an open-source CLI agent with strong reasoning capabilities and cost efficiency.
## Honorable Mentions
**Tabnine** - Privacy-focused code completion with on-premises deployment options and team learning. Good for enterprises with strict data requirements.
**Cline** - Local-first VS Code agent that runs entirely on your machine. Great for privacy-conscious developers who want AI assistance without cloud dependencies.
**Aider** - Git-aware pair programming tool that understands your repository structure and commit history. Excellent for maintaining context in version-controlled projects.
## How to Choose the Right Tool for Your Needs
Before diving into specific recommendations, consider these criteria when evaluating AI coding tools:
**Development approach** - Some tools excel at quick prototyping, others at maintaining large codebases. Match the tool to your project phase.
**Environment preference** - Terminal developers work differently from IDE users. Browser-based tools suit different workflows than local-first solutions.
**Team vs solo** - Collaboration features matter for team projects. Solo developers benefit from different capabilities.
**Model flexibility** - Access to multiple AI models (Claude, GPT, Gemini) gives you options when one struggles with your specific task.
**Codebase size** - Tools with large context windows handle big projects better. Smaller projects work fine with any tool.
**Integration requirements** - GitHub workflows, AWS services, or specific frameworks might push you toward certain tools.
### Quick Decision Matrix
| Tool | For Developers | For Vibe Coders | Environment | Why |
| ------------------ | -------------- | --------------- | ----------- | --------------------------------------------- |
| Cursor | Yes | Yes | IDE | Strong autocomplete + natural language agents |
| Windsurf | Yes | Yes | IDE | Multi-file editing with natural language |
| GitHub Copilot | Yes | Yes | IDE Plugin | Great autocomplete, limited natural language |
| Kiro | Yes | Yes | IDE Plugin | Spec-driven slows vibe coding |
| Google Antigravity | Yes | Yes | IDE | Autonomous agents with natural language |
| Lovable | Kinda | Yes | Browser | Full-stack generation, less precise control |
| Bolt | Kinda | Yes | Browser | Prompt-to-app, less granular control |
| Replit | Yes | Yes | Browser | Collaboration + AI assistance |
| Claude Code | Yes | Yes | CLI | Terminal-native with natural language |
| Warp | Yes | Kinda | CLI | Better UX, limited natural language |
| Gemini CLI | Yes | Kinda | CLI | Large context, less conversational |
| OpenAI Codex | Yes | Yes | API | GPT-5 with natural language workflow |
| Tabnine | Yes | No | IDE Plugin | Autocomplete only, no agents |
| Cline | Yes | Yes | IDE Plugin | Local agent with natural language |
| Aider | Yes | Kinda | CLI | Git-focused, requires some precision |
### For Vibe Coders
For developers who want to describe features in plain English and let AI handle implementation:
**Cursor** leads here with **Agent mode** and parallel agents. The natural language understanding is strong, and the multi-file editing works reliably. Background agents let you describe tasks and get PRs when complete.
**Claude Code** excels in the terminal for natural language workflows. You can describe complex multi-step operations, and it handles file system operations, git commands, and code changes while maintaining context.
**Windsurf** offers similar capabilities to Cursor with solid natural language understanding and coordinated multi-file changes.
### UI-Focused Development
When you need visual interfaces quickly:
**v0** generates production-quality React components with shadcn/ui and Tailwind. The components are clean, accessible, and ready to drop into Next.js applications. The iteration speed is impressive - describe changes and see them instantly.
**Bolt** creates complete UI with routing and state management. The framework flexibility means you can generate Next.js, Remix, or vanilla setups based on project requirements.
**Lovable** builds full interfaces with live preview. The Claude 4 integration delivers fewer errors and faster execution. Good for when you need a complete frontend quickly.
### Full-Stack Applications
For building complete applications with backend infrastructure:
**Convex Chef** stands out by generating both frontend and backend. You get database, auth, file storage, and background workflows without manual setup. The TypeScript-first approach means type safety across your entire stack. Being open source lets you customize the generation or self-host if needed.
### Heavy Development
For experienced developers working on complex, production codebases:
Use **Cursor** and **Claude Code** together. This combination gives you the best of both worlds.
**Cursor Tab** provides inline suggestions that are fast and context-aware. The autocomplete speed is impressive - it suggests completions as you type with minimal latency. Use this for day-to-day coding when you know what you're building but want intelligent assistance with syntax and boilerplate.
**Composer** is Cursor's fast model designed for quick tasks. It handles simple refactors, bug fixes, and straightforward features quickly without the cost or latency of frontier models. Use Composer for tasks you could handle yourself but want to speed up.
**Claude Code** excels at planning and executing complex, multi-layer features. Open a terminal alongside Cursor and run Claude Code there. Use it for architectural decisions, complex refactoring that requires understanding system interactions, debugging intricate issues, and tasks that span multiple components. Claude Code's strength is maintaining context across complex operations and coordinating file edits with terminal commands.
The workflow: code in Cursor with Tab for inline suggestions and Composer for quick tasks. When you hit a complex feature that needs planning and coordination, switch to Claude Code in your terminal and toggle to **Plan Mode**. If you run out of Claude Code tokens, fall back to Cursor's agent mode to continue. This combination keeps you productive regardless of task complexity or token limits.
## The Future: Multi-Agent Systems
The most interesting development isn't better autocomplete - it's coordinated multi-agent systems. Tools like Windsurf's Cascade, Google Antigravity's agent workspace, and Claude Code's sub-agent system show where things are heading.
Instead of asking an AI to make specific changes, you describe the outcome you want and agents coordinate to make it happen. One agent analyzes architecture, another handles refactoring, a third updates tests, and a fourth generates documentation.
Claude Code implements this with built-in specialized agents. The Explore agent uses Haiku (cheaper and faster) to search your codebase and gather context for the main orchestrator agent. You can also create custom sub-agents for specific tasks in your workflow. This agent hierarchy means the expensive frontier model only runs when you need deep reasoning, while cheaper models handle research and context gathering.
This means less manual orchestration. You spend less time thinking about how to break down changes and more time reviewing results. The agent systems handle coordination, dependency ordering, and error recovery.
The trend is toward specialized agents collaborating on distinct tasks rather than one monolithic AI trying to do everything. Each agent has specific expertise and responsibilities, similar to how you'd divide work among team members.
## Key Takeaways
Most tools offer free tiers - experiment to find what works for you. Context-aware assistants that understand your codebase beat simple autocomplete every time.
Multi-agent systems represent the next evolution in AI coding assistance. Security features matter when you're shipping production code - evaluate what data leaves your machine.
There's no one-size-fits-all solution. Choose based on your actual workflow, not feature lists. Open source options exist for developers with privacy concerns or specific customization needs.
The tools that fit your development environment naturally will get used. The ones that force workflow changes will gather dust.
## Conclusion
AI coding assistants moved from novelty to necessity faster than most of us expected. The best tool depends on your environment, use case, and workflow - not which one has the most impressive demo.
Start with free tiers to find what actually fits your development style. The future is collaborative AI agents working together to handle complex tasks autonomously.
The tools exist. The question is which ones match how you actually work.
## Try Shuttle for Your Next Rust Project
Speaking of better development workflows - if you're building in Rust, Shuttle removes infrastructure headaches so you can focus on code. Deploy your Rust applications with a single command:
```bash
shuttle init --template axum
```
And when you're ready to deploy, just run:
```bash
shuttle deploy
```
And you're done!
Check out our templates and get started at [Shuttle Templates](https://console.shuttle.dev/templates)
---
## Frequently Asked Questions
---
# Gemini 3 Pro: Google's Latest AI Model Hits the Scene
Source: https://www.shuttle.dev/blog/2025/11/18/gemini-3
Date: 18 November 2025
Author: dcodes
Tags: ai, gemini, llm, benchmarks
Google drops Gemini 3 Pro with impressive benchmarks and real-world performance. We look at what the numbers say and what developers are actually experiencing.
Google released Gemini 3 Pro today on _November 18, 2025_, and the AI community wasted no time putting it through its paces. The model tops the [LMArena](https://lmarena.ai/leaderboard) with a 1501 Elo score, the highest rating on the leaderboard.
## What's New
Gemini 3 Pro combines reasoning, multimodal understanding, and agentic capabilities in one model. Google positions it as a significant step toward AGI, though we'll let the benchmarks and real-world usage speak for themselves.
The model comes in two flavors:
- **Gemini 3 Pro**: The standard model with strong baseline performance
- **Gemini 3 Deep Think**: An enhanced reasoning mode that pushes performance further on complex problems
## Performance Numbers
The benchmarks show strong performance across academic reasoning, math, visual understanding, and coding tasks. Gemini 3 Pro outperforms previous models on most tests, with particularly notable improvements in visual understanding (ScreenSpot-Pro jumps from 11.4% to 72.7%) and competitive math problems (MathArena Apex at 23.4% vs. 0.5% for Gemini 2.5 Pro).
## What Developers Are Saying
The community is overwhelmingly positive. Users report that Gemini 3 Pro handles math, physics, and coding tasks well. Several developers mention it's passing private benchmarks where other state-of-the-art models fail.
One notable aspect is visual understanding. The model's ability to recognize and understand elements in images is impressive.
For coding, developers using it in Cursor IDE report positive experiences. The model appears to handle complex spatial reasoning problems better than previous models, with users mentioning it solving problems that typically trip up other AI systems.
The Deep Think mode, when set to "thinking mode high," shows DeepThink-like performance. It's capable of solving complex problems that typically trip up other AI systems.
## Gemini 3 Deep Think
Gemini 3 Deep Think represents a step-change in reasoning capabilities, effectively setting a new State of the Art (SOTA) for complex problem-solving. It pushes boundaries where standard models plateau.
In benchmarks, it delivers impressive results:
- **Humanity's Last Exam**: 41.0% (without tools)
- **GPQA Diamond**: 93.8%
- **ARC-AGI-2**: 45.1% (with code execution)
For developers, this matters because of the focus on "novel challenges." The 45.1% score on ARC-AGI-2 is particularly telling - it measures the model's ability to adapt to new problems rather than regurgitating memorized patterns. This suggests Deep Think will be a more reliable partner for debugging obscure race conditions or architecting complex systems where there isn't a StackOverflow answer ready to copy-paste.
## Three Core Use Cases
Google positions Gemini 3 around three main capabilities:
**Learn Anything**: The model handles multimodal learning across text, images, video, audio, and code with a 1 million-token context window. It can translate handwritten recipes, generate interactive materials from academic papers, and analyze sports videos. AI Mode in Google Search now uses Gemini 3 for its generative UI experiences.
**Build Anything**: Positioned as Google's best coding model yet, it is available in Google AI Studio, Vertex AI, the Gemini CLI, and Google Antigravity (more on that below). Third-party integrations include Cursor, GitHub, JetBrains, Manus, and Replit.
**Plan Anything**: The model tops Vending-Bench 2 for long-horizon planning and can maintain consistent tool usage over extended workflows. Google is making a Gemini Agent available for Google AI Ultra subscribers in the coming weeks.
## Google Antigravity
Alongside Gemini 3, Google launched Antigravity, an agentic development platform that gives AI agents direct access to the editor, terminal, and browser. The system uses Gemini 3 Pro, Gemini 2.5 Computer Use, and Nano Banana (Gemini 2.5 Image) to autonomously plan and execute software tasks.
The platform aims to make AI more of an active development partner rather than just a tool you query. Agents can handle complex, end-to-end tasks with less hand-holding.
## Safety and Availability
Google emphasizes that Gemini 3 includes comprehensive safety evaluations with reduced sycophancy, increased resistance to prompt injections, and enhanced protection against cyberattacks. The model has been evaluated by independent assessors and security experts.
**Current Availability:**
- Gemini app and AI Mode in Search (Pro/Ultra subscribers)
- Google AI Studio and Antigravity
- Gemini CLI and Vertex AI
- Third-party integrations (Cursor, GitHub, JetBrains, etc.)
The Deep Think mode will roll out to Google AI Ultra subscribers in the coming weeks.
## What This Means for Developers
We are developers and we're super excited when a new model comes out that we can use to build better software. Let's dive in on what this means for us developers.
Gemini 3 Pro brings some practical improvements to the table.
The agentic coding capabilities stand out. The model can actually use a terminal, not just write code, but execute commands, debug issues, and handle multi-step workflows. It is available in Cursor, GitHub, JetBrains, Cline, and other IDEs you are already using.
For vibe coding (turning natural language into working apps), Gemini 3 Pro tops the WebDev Arena leaderboard at 1487 Elo. The model handles complex instruction following well enough that you can describe what you want and get functional, interactive code without multiple rounds of refinement. Google AI Studio's Build mode is optimized for this, going from a single prompt to a working app.
The multimodal understanding improvements matter for practical applications. Document understanding goes beyond simple OCR to handle complex layouts and reasoning. Spatial reasoning enables screen understanding for computer use agents, allowing the model to interpret UI elements, mouse movements, and screen annotations. Video understanding handles high frame rates and long-context recall, which is useful for processing hours of footage.
Gemini 3 Pro integrates into production workflows through the Gemini API (available in Google AI Studio and Vertex AI). Pricing is $2/million input tokens and $12/million output tokens for prompts under 200k tokens. You get rate-limited free access in Google AI Studio for testing.
The model includes a client-side bash tool for local filesystem navigation and system operations, plus a server-side bash tool for multi-language code generation. Grounding with Google Search and URL context now work with structured outputs, which helps when building agents that fetch data and need specific output formats.
Google Antigravity is their new agentic development platform where you work with autonomous agents that have direct access to the editor, terminal, and browser. The agents handle planning and execution while you focus on architecture. It is available now for MacOS, Windows, and Linux.
## Final Thoughts
Gemini 3 Pro is the first model on the LMArena leaderboard, and according to developer communities, it is likely the best coding model available right now. The multimodal capabilities and coding performance stand out.
What makes Deep Think particularly interesting is its focus on "novel challenges." or problems that are not in the training data. The 45.1% score on ARC-AGI-2 suggests it can adapt to new problems rather than just regurgitating memorized patterns. For developers, this promises a more reliable partner for debugging obscure race conditions or architecting complex systems where you can't just rely on existing answers.
If you are building with AI, Gemini 3 Pro is worth testing, especially for agentic workflows and terminal-based development. The model integrates into the tools developers actually use, and the pricing is reasonable for experimentation.
## Get Started with Rust and AI
LLMs are getting more powerful for Rust development. Try our Axum template and let us know how it worked out for you:
```bash
shuttle init --template axum
```
Join our Discord to discuss Gemini 3 Pro and share your thoughts on the model.
---
# Kimi K2 Thinking Review: Testing the Open-Source Reasoning Model on Real Code
Source: https://www.shuttle.dev/blog/2025/11/17/kimi-k2-thinking-hands-on-review
Date: 17 November 2025
Author: dcodes
Tags: ai, llm, coding, rust
I put Moonshot AI's new K2 Thinking large language model to the test on the Shuttle codebase to see if the hype around its reasoning capabilities holds up in practice
Last week Moonshot AI released an upgraded version of their Kimi K2 open source model with thinking capabilities. The benchmarks are competitive and the pricing is cheaper than other proprietary models. But competitive benchmarks don't tell the whole story. That's not what caught my attention.
The real problem with AI coding assistants is tool use. They forget context, repeat themselves, or drift off track. For developers working with codebases, this is a dealbreaker. You need file searches, code reads, edits, test runs, all chained together without the large language model falling apart.
K2 Thinking is built and tested specifically to handle large amounts of sequential tool calls while maintaining coherence. It performs continuous cycles of reasoning, searching, browsing, and code implementation without losing the thread. For coding tasks that involve MCP servers and extensive tool use, this changes what's possible.
I tested it on a production codebase to see how it performs on real software engineering tasks.
## What Makes K2 Thinking Different
Before we dive into the hands-on experience, let's take a look at the technical details of the model.
Kimi K2 is open source, and unlike the closed source models, it shows you its reasoning process before responding. The model architecture uses a Mixture-of-Experts (MoE) design with **1 trillion token parameters**, but only **32 billion active parameters per inference** across **61 layers with 384 experts**, selecting **8 per token** and offering a **256K token context window**. The MoE design is what makes it remotely runnable on consumer hardware. Instead of loading all trillion parameters, you're working with 32 billion active parameters at any given time while the rest sit dormant until needed.
## The Benchmark Story
Moonshot published some strong numbers, and they're competing directly with closed models like GPT-5 and Claude Sonnet 4.5:
| Benchmark | K2 Thinking Score | Notes |
| -------------------- | ----------------- | ----------------------------------------------------------- |
| SWE-Bench Verified | 71.3% | The one I care about for coding tasks |
| BrowseComp | 60.2% | vs GPT-5's 54.9% for agentic capabilities in search |
| AIME25 | 99.1% | Near-perfect on math competition problems with Python tools |
| LiveCodeBench v6 | 83.1% | Competitive programming |
| Humanity's Last Exam | 44.9% | Beating both GPT-5 and Claude with tools |
The SWE-Bench score is particularly interesting because that benchmark measures benchmark performance on actual software engineering tasks - the kind of real world testing I wanted to evaluate.
## Review: Kimi K2 Thinking on a Real Codebase
Benchmarks always inflate the capabilities of the model, and sometimes they don't accurately reflect the model's reasoning capabilities when it comes to actual use cases. For that reason, I'm going to review the model on a real codebase and give it a real task to solve.
The task I've chosen includes a large codebase with very large files, some of the files are over 2000 lines of code. It requires a lot of context along with reasoning to solve the problem. It also requires codebase navigation to find the relevant files and pieces of code, which makes it a good test for the model's tool use and agentic capabilities.
The GitHub issue that I chose can be found [here in the Shuttle repository](https://github.com/shuttle-hq/shuttle/issues/2055).
> To summarize the issue: when you create a project with the Shuttle CLI, it generates a `.shuttle/config.toml` file storing your project ID, but when you run `shuttle project delete`, the project gets removed from the platform while the _stale project ID_ stays in your local config file. This stale value causes confusion in subsequent CLI commands since the CLI tries to use a project ID that doesn't exist anymore. Similarly, if you delete a project and create a new one, the old ID persists instead of updating to the new project's ID. The fix needs config file management to delete the project ID when running `shuttle project delete` and update the config with the new project ID when running `shuttle project create`.
### The Prompt
I wanted to give it a very high level prompt without delving into the details and give the model a chance to understand the problem and come up with a plan by itself.
Here's the prompt:
````md
# Issue #2055: Auto update project id in .shuttle/config.toml on project creation
Project ID stored in `.shuttle/config.toml` will be stale if the project is deleted
or a new project is created.
Update `.shuttle/config.toml` with the new project ID when creating a project with
`shuttle project create` and delete it when the project is deleted with
`shuttle project delete`, so it doesn't keep the old ID after deletion.
`.shuttle/config.toml` example:
```toml
id = "proj_01K9CHACCQ3RN8D5HJ91F141AN"
```
````
### Kimi K2 Thinking in Action
Like any other model, the first step is to search the codebase and collect context. K2 used `find` to locate project-related files, ran `Grep` searches for `project create` and `project delete`, then found and read `cargo-shuttle/src/lib.rs` and `cargo-shuttle/src/config.rs` to understand how the config management works.
Worth noting: the `lib.rs` file is over 2000 lines, and most AI coding assistants struggle with files this size. K2 Thinking read it, understood the structure, and correctly identified where the code generation needed to happen. After the exploration phase, it presented a plan and started the code implementation.
## Testing the Implementation
It updated the codebase and wrote some code. The code compiles without any errors, but the real question is if it works as expected.
The script that I used for testing is below, it just compiles the code and creates an alias for the dev CLI:
```sh
#!/bin/sh
(cd /home/dev/Desktop/shuttle/ && cargo build) # Compile the code
alias shuttle-dev=/home/dev/Desktop/shuttle/target/debug/shuttle # Create an alias for the dev CLI
# Subsequent commands can be run with the alias:
# shuttle-dev project create --name my-axum-app
# shuttle-dev project delete
# shuttle-dev project create --name my-axum-app
```
**Test 1: Project Creation**
Running `shuttle-dev project create --name my-axum-app`:
Success. The project was created with ID `proj_01KA3S8JN8TNWBGSJZFJRXM7PG`, and checking `.shuttle/config.toml`:
The config file was updated correctly with the new project ID.
**Test 2: Project Deletion**
Running `shuttle-dev project delete`:
The project was deleted from the platform. Checking the config file:
Empty. The stale project ID is gone.
**Test 3: Creating a New Project After Deletion**
The final scenario: delete a project, create a new one, and verify the config syncs with the new ID.
Running `shuttle-dev project create --name my-new-axum-app`:
The config updated with the new project ID (`proj_01KA3SE04947EBMCF2RMZQT3BP`). Everything stayed in sync.
All three test cases ✅ passed. The solution performed exactly as needed.
---
## Review Summary
K2 Thinking handled this specific task well. It explored a large codebase systematically, understood the context across a 2000+ line file, and implemented a working solution on the first try. The thinking capabilities showed their value in the methodical reasoning process. Rather than jumping to conclusions, it mapped out the codebase structure before making changes.
This was a real-world coding task, not a synthetic benchmark, and it worked well. That said, it doesn't mean it will work on all projects. Success depends on the type of complexity involved. For this particular issue (understanding config file management and modifying CLI commands), the model performed solidly.
The tradeoff is speed. This isn't a fast model. The thinking phase adds latency, and for simple tasks, that overhead might not be worth it. But for complex codebases where understanding context matters more than raw speed, the deliberate approach pays off.
Would I use it for quick one-off scripts or simple bug fixes? Probably not. For navigating unfamiliar production codebases and making changes that need to be right the first time? It's a solid option, especially considering it's an open source model and you can run it locally (if you have the hardware).
The benchmark numbers hold up in practice. The 71.3% SWE-Bench score makes sense after seeing it work through a real engineering task. Not perfect, but capable enough to be useful.
## Working with AI Coding Tools
If you're interested in getting the most out of AI coding assistants like Claude Code, check out our [comprehensive guide on best practices](https://www.shuttle.dev/blog/2025/10/16/claude-code-best-practices?utm_source=shuttle_blog&utm_medium=blog&utm_campaign=kimi_k2_thinking).
It covers practical techniques for prompt engineering, codebase navigation, debugging workflows, and how to structure your projects to work effectively with AI assistants.
Join our Discord server to stay updated on the latest AI coding tools and best practices.
---
# Infrastructure as Code Problems: Why Developers Are Wasting Their Time
Source: https://www.shuttle.dev/blog/2025/11/13/infrastructure-as-code-problems
Date: 13 November 2025
Author: demola
Tags: infrastructure, devops, terraform, deployment
You didn't hire developers to debug Terraform state files. Yet here we are. This breakdown shows what IaC is really costing you and how to stop the bleeding.
51% of your developers are spending more than 20% of their time managing infrastructure code. At an average salary of $150,000 a year, that's $30,000 in lost productivity per engineer. For a 10-person team, you're spending $300,000 a year to babysit YAML instead of building products.
Infrastructure as Code (IaC) was supposed to give you [automation](https://www.shuttle.dev/blog/2025/10/21/github-integration), version control, and stable environments. So why are modules piling up faster than your team can refactor them? Why does every [infrastructure change](https://www.shuttle.dev/blog/2022/05/09/ifc) feel like a gamble? Why do state files keep drifting out of sync, blocking work you thought was already done?
Let's break down how Infrastructure as Code has become a hidden cost center and what a better path forward looks like.
## How Infrastructure as Code is Slowing Developers Down
When you have a dedicated infrastructure team, even simple requests can turn into a waiting game. Spinning up a quick proof-of-concept app to show a colleague might mean going through approvals, resource requests, and tickets before anything happens. That process kills momentum. You lose the freedom to experiment, which slows shipping.
Here's what makes it worse:
### Too Many Config Files
IaC usually starts small. Maybe it's a 50-line Terraform config to spin up a basic web service. But as the project grows, you need to consider scalability, databases, and networking. Suddenly, your once-minimal configuration balloons to 500+ lines spread across multiple files. Every new service, subnet, or secret adds another layer of complexity to an already bloated system.
### Refactoring Pain
Variables, modules, and providers make IaC flexible and reusable, but maintaining it is still tricky. Most of the time, you end up digging through multiple files to make a small change. For example, renaming a resource might sound simple, but if you miss updating every reference to it, you could accidentally destroy and recreate infrastructure in production.
As [Matt Moore](https://thenewstack.io/infrastructure-as-code-in-2024-why-its-still-so-terrible/), CTO at Chainguard, put it: "Having used Terraform extensively, refactoring is extremely painful." This is not an exaggeration. Even a small refactor can break dependencies or invalidate states, forcing you to rewrite chunks of code. That's valuable time that could have gone into shipping new features instead of firefighting broken infrastructure.
### State File Problem
Terraform uses a state file to stay consistent and reliable while managing infrastructure across multiple cloud providers. As important as it is, the state file can also become a major pain point. Since it serves as the single source of truth, it's also a single point of failure. It's prone to drift, corruption, or merge conflicts during team collaboration. Something as simple as your colleague running a `terraform apply` might lock the state file and block your deployment.
The net effect of all the challenges above hits harder than most teams admit. Development cycles slow down, features miss deadlines, and engineers spend evenings debugging HashiCorp Configuration Language (HCL) syntax instead of solving interesting problems.
A [recent report](https://stackgen.com/stackedup-infographic-2025) shows that 75% of infrastructure stakeholders feel frustrated chasing these configuration errors, which makes development drag on much longer than it should.
The moment you factor in how much time your team is spending to keep things stable, the cost becomes hard to ignore.
## The Hidden Costs of Infrastructure as Code for Teams
As we calculated earlier, a 10-person team spending one day a week on infrastructure loses $300,000 in time alone. But that isn't the cost that hurts the most.
**Knowledge silos** form faster than you can stop them. The same "Terraform person" who helped ship early features suddenly becomes the bottleneck for every new project. When new hires join, onboarding takes weeks because that one expert is juggling infrastructure work while also trying to explain thousands of lines of configuration spread across multiple repositories.
Then there's **burnout**. Engineers join to build things, not debug infrastructure that won't reconcile after a provider update. No developer dreams of that. They want to create products, solve problems, and see their work make an impact. When debugging infrastructure consumes a big part of their day, frustration builds, and some start looking for exits.
Eventually, every team hits the same wall: too many configs, too much boilerplate, and not enough actual building. It's not that IaC failed; it just became heavy. The good news is that a new kind of platform is changing the story. Instead of writing long scripts or wrestling with complex IaC module logic, you describe your environment alongside your application logic, and the tooling handles the "how."
## From Infrastructure as Code to Infrastructure from Code
If IaC feels like extra work, it's because it is. It forces you to separate how you build from how you deploy. You're writing configuration in one language and application logic in another, even though they describe the same system. That split creates constant friction and slows development.
So, what's the fix? Instead of managing a parallel stack of configuration files, what if you could eliminate them? That is the power of Infrastructure from Code.
The IfC model takes a different stance. It argues that your infrastructure needs should live inside your application code, right where you use them. Instead of maintaining a 300-line Terraform file, your infrastructure becomes a short annotation or macro on the function that requires the resource.
This isn't just about convenience. It removes an entire category of work. With Infrastructure from Code, your infrastructure is:
- Co-located: It lives directly in your `main.rs` file, not in a separate infra repository.
- Obvious: Anyone reading your code can see exactly what resources it depends on.
- Always in sync: It is reviewed, versioned, and deployed as a single unit with your application. There is no state drift because the code is the definition.
Shuttle was built on this core philosophy of making your code declare its own needs.
## How Shuttle Manages Infrastructure and Development Together
[Shuttle](https://www.shuttle.dev/) takes a fundamentally different approach. Instead of managing infrastructure through separate configuration files, you declare what you need directly in your application code using annotations.
To see this in action, let's compare it with IaC. Say you want to deploy a web application with a database and plan to scale as you go. With IaC, your configuration might look like this:
- `main.tf`: Provider configuration with backend setup (approximately 30 lines)
- `vpc.tf`: VPC, subnets, internet gateway, route tables (80 lines)
- `security-groups.tf`: Ingress/egress rules for app and database (40 lines)
- `rds.tf`: Database instance, parameter groups, backup config (50 lines)
- `ecs.tf`: Cluster, task definitions, service configuration (60 lines)
- `variables.tf`: Input variables (20 lines)
- `outputs.tf`: Connection strings and endpoints (15 lines)
That's roughly 300 lines of IaC code across seven files, not counting logging, monitoring, or environment-specific configurations.
In comparison, doing the same thing with Shuttle is far simpler. You don't need separate files for your application logic and infrastructure. You simply create your application and annotate the resources you need (a database in this example):
```rust
#[shuttle_runtime::main]
async fn main(
#[shuttle_shared_db::Postgres] pool: PgPool,
) -> ShuttleAxum {
pool.execute(include_str!("../schema.sql"))
.await
.map_err(CustomError::new)?;
// other application code here
}
```
This looks like your normal application code, with a few additions. You'll notice the use of Rust macros to annotate the code:
- `#[shuttle_runtime::main]` provisions the Shuttle runtime environment where your app runs.
- `#[shuttle_shared_db::Postgres]` configures a Postgres database and injects a connection pool that your app can query directly.
Once you run the `shuttle deploy` command, Shuttle automatically initializes and provisions the resources your application needs, leaving you free to focus on what matters.
That's all you need to do. No YAML, HCL, or state files to manage. Your development and infrastructure code remain tightly coupled, giving you greater control as you build and scale.
With Shuttle, your IaC burden drops significantly:
- Updates happen automatically, and provider changes, security patches, and infrastructure updates are handled behind the scenes while your annotations stay the same.
- You can prototype quickly with low effort and get built-in support for popular Rust frameworks.
- You ship faster since you no longer need to switch contexts between development and infrastructure code.
- Fast redeployment and local iteration make it easy to test changes without long build times.
Once you see how Shuttle keeps your app and infrastructure in sync, the next question is obvious: How do you start using it? The good news is you don't have to rewrite everything from scratch. Shuttle's migration flow is designed to meet you where your code is and get you running fast.
## How to Migrate to Shuttle Without Breaking Things
You don't need to treat migration like a six-month project. You can start in ten minutes. Every day you delay is another day of lost developer time.
Here's how to move forward without disruption:
- Start with new services: Stop building new projects on the old stack. Every new service you create should begin on Shuttle. It keeps your infrastructure close to your code and prevents the sprawl that slows teams down.
- Migrate one small, painful service: Pick a microservice that is always difficult to deploy. The one with fragile pipelines or constant configuration drift. Move that first. You'll have it running on Shuttle in an afternoon.
- Run in parallel: Keep your existing setup alive while testing the Shuttle version. You'll see the difference immediately. Deployments that once took hours now take seconds.
- Build confidence gradually: Once you've seen the results, migrate other services one by one. Each move will take less time than the last.
- Yes, Rust has a learning curve. But here's what you're not accounting for: you're already paying that cost in IaC complexity. The difference is, Rust's complexity is front-loaded and one-time, while IaC complexity compounds over time.
Migration is about recovery. Every week spent maintaining IaC is time and money lost. Shuttle gives that time back.
## Stop Paying Developers To Manage Infrastructure
Every year, your developers spend thousands of hours maintaining infrastructure they were never hired to manage. That's $30,000 of wasted time per engineer, and $300,000 for a ten-person team that could be building instead.
IaC was meant to make engineering easier. Instead, it created a new set of challenges that drain time, money, and morale.
Shuttle's approach of collapsing configuration into annotations, automating provisioning, and eliminating state management isn't just incrementally better. It's a fundamental rethinking of how infrastructure should work. This means more building and less time babysitting configuration files.
Ready to see how Shuttle eliminates IaC complexity? Try out our axum template and deploy in minutes.
```bash
shuttle init --template axum
```
---
# Building Rust Web Apps
Source: https://www.shuttle.dev/blog/2025/11/12/build-rust-web-apps
Date: 12 November 2025
Author: dcodes
Tags: rust, web development, guide, axum, sqlx
A practical guide to building production-ready web applications in Rust, cutting through framework confusion to help you make informed stack decisions.
Rust promises zero-cost abstractions and blazingly fast performance, but when you're ready to build a web application, you quickly realize it's not "batteries included" like other languages, especially for the web. Unlike Go with its standard library HTTP server or Python with Django, Rust makes you choose everything: your web framework, database library, templating engine, and more.
The world of web development using Rust has evolved significantly, with frameworks like Actix Web and Axum leading the charge. This guide provides practical resources and real-world examples to help developers build web applications without getting lost in framework comparisons.
Here's what I've learned from trying out many different frameworks and libraries: Rust's lack of a garbage collector and minimal memory footprint make it exceptional for web development and microservices. You can scale horizontally without the overhead of spawning a garbage collector for each service—your services can be using as little as 5MB of memory when idle. Also when it comes to processing large datasets or building performance-critical web applications, Rust's speed will put you in the fast lane.
This guide cuts through the noise to help you make informed choices about your web stack without spending weeks researching. It will be a little opinionated as well when it comes to recommendations section. So, let's get started!
## Why Rust for Web Development?
Rust delivers on its promise of zero-cost abstractions. You get functional programming patterns like `Option` and `Result` types, powerful pattern matching, and efficient iterators without runtime overhead. The compiler enforces memory safety at compile time, and without a garbage collector your performance is predictable.
Rust does have a learning curve, especially if you're coming from garbage-collected languages. The borrow checker takes time to understand, and you'll initially spend more time satisfying the compiler than writing features. But once you internalize ownership and borrowing, you'll write safer code naturally and implement features more confidently. Whether you're building a simple rust web page or a complex microservices architecture, these fundamentals apply.
There are areas in which you wouldn't want to use Rust, for example rapid prototyping or if you're still learning web development concepts. Go or JavaScript might be better choices in those cases. Rust shines when you need reliability, performance, and optimized resource consumption. For developers building production web applications, these trade-offs often make sense.
## The Framework Landscape
### Choosing a Web Framework
Rust isn't _"Batteries Included"_ but the good news is that Rust for the web has a mature ecosystem of production-ready backend frameworks. Many of these frameworks are actively maintained and have a strong community behind them, some of the most popular ones are:
**Axum** is what I recommend for beginners. It produces fewer _arcane_ compiler errors because it uses common ecosystem crates rather than reinventing everything. The learning curve is gentler, and you'll spend less time fighting the type system. For example, setting up a basic route handler to process HTTP requests is straightforward and intuitive.
**Actix Web** is the battle-tested performance leader with excellent documentation. If you need proven reliability at scale, this is your choice. Many production projects using Rust run on Actix Web, handling millions of requests per day.
**Rocket** offers solid ergonomics and a pleasant development experience. It's a dependable alternative that many teams use successfully.
**Tide** focuses on productivity with minimal bloat. It's clean and straightforward.
There's also **Rouille**, a synchronous framework worth mentioning. Most developers assume async is always better, but Rouille takes a different approach. It ignores async I/O complexity and provides an easy-to-use synchronous API where each HTTP request is handled in its own dedicated thread, and responses are sent back immediately.
The reasoning is pragmatic: async I/O libraries in Rust are still maturing, and you'd need async database clients and async file loading to fully benefit from async frameworks. Until the ecosystem catches up, Rouille focuses on simplicity.
### Database Integration
**SQLx** is the pragmatic choice and widely adopted in the Rust community. It lets you write direct SQL rather than wrestling with ORM abstractions, which means your queries are clearer and you maintain full control—it also gives you better performance than ORMs. The optional compile-time query verification catches SQL errors before runtime. SQLx supports PostgreSQL, MySQL, and SQLite out of the box, making it easy to create database connections for any project.
When choosing a database, don't optimize for ease of setup. Choose based on your data modeling needs:
**PostgreSQL** is a popular, widely-used relational database known for its performance, scalability, and rich feature set.
**SQLite** is perfect for embedded use cases or applications where you want zero configuration.
**MySQL** is another widely-adopted relational database that's known for its speed and reliability in web applications.
If you prefer ORMs, the Rust ecosystem has solid options:
**SeaORM** is a modern async ORM with a developer-friendly API. It generates entities from your database schema and provides a fluent query builder. The API feels natural for developers coming from other ecosystems.
**Diesel** is a mature, compile-time verified ORM that's been production-tested for years, used extensively by the Crates.io repository. It's more opinionated about structure but catches query errors at compile time. Some teams find its macro-heavy approach verbose, but others appreciate the safety guarantees.
You can check out our blog about Rust ORMs [here](https://www.shuttle.dev/blog/2024/01/16/best-orm-rust?utm_source=building_rust_web_apps&utm_medium=blog&utm_campaign=building_rust_web_apps).
### Server Side Rendering with Templates
Templating engines let you generate HTML dynamically by combining static markup with data from your application. They handle the common patterns of web rendering: loops, conditionals, variable interpolation, and template inheritance. Instead of manually concatenating strings or building HTML in your Rust code, you write templates that separate presentation from logic. For example, `{{ user.name }}` in Jinja2/Tera, `<%= user.name %>` in ERB, or `{{ user.name }}` in Handlebars all inject data into your HTML.
**[Tera](https://keats.github.io/tera/)** integrates strongly with Actix-web and has solid documentation. If you've used Jinja2 or Django templates, Tera's syntax will feel familiar. It's the safe, practical choice for server-side rendering your rust web page.
Here's an example of a Tera template:
```html
Welcome, {{ user.name }}
{% for item in items %}
{{ item.title }} - ${{ item.price }}
{% endfor %}
```
### Frontend Considerations
When building web applications, you need to decide how to handle the user interface. The frontend is what users interact with in their browsers, and there are different approaches to building it. You can render HTML on the server and send complete pages, or build a client-side application that runs JavaScript in the browser and communicates with your backend via API URLs.
Not every website needs to be a [single-page application (SPA)](https://en.wikipedia.org/wiki/Single-page_application). Before reaching for a frontend framework, consider server side rendering with your backend framework. SSR with templates like Tera can handle many use cases without the complexity, and lets you implement features faster.
If you do need a frontend framework, here are your Rust options:
**Yew** is the most mature Rust WASM framework. It uses actual HTML, which means you're learning standard web technologies rather than custom macro syntax. The ecosystem has grown considerably.
**Perseus** is a modern alternative worth exploring. It provides a Next.js-like experience with server-side rendering and static generation support. The architecture is thoughtful and the documentation is improving.
**Seed** takes a different approach with an Elm-like architecture. However, I'd avoid frameworks that rely heavily on macros for templating. Learning HTML plus macro syntax is double work, and you lose the benefit of standard tooling.
However, in reality, Rust WASM frontend frameworks aren't quite production-ready for all use cases. Backend frameworks are mature and battle-tested, but frontend frameworks are still evolving. For production applications today, consider using React, Vue, or Svelte for your frontend and Rust for your backend.
**HTMX** deserves special mention here. It's not a framework but a library that lets you access modern browser features directly from HTML. Combined with server side rendering, HTMX gives you dynamic interfaces without complex client-side state management. This is a pragmatic middle ground worth considering, allowing developers to create interactive web pages without writing JavaScript.
## Project Structure
As your Rust web application grows beyond a simple example, modularity becomes crucial. Splitting your code into modules provides cleaner separation of concerns, makes testing easier, and keeps your codebase maintainable. A monolithic `main.rs` quickly becomes unwieldy in production applications.
When starting a new project, choosing the right structure from the beginning saves refactoring time later. Whether you're building your first Rust project or refactoring an existing one, there are many ways to organize your code to help you create maintainable applications. Here are two common approaches:
**Function-based structure** groups by technical role: `routes/`, `handlers/`, `models/`, and `services/`. This makes the technical architecture clear at a glance and helps developers understand the project organization quickly.
**Model-based structure** groups by domain: `users/routes.rs`, `users/handlers.rs`, `posts/routes.rs`, `posts/handlers.rs`. If you need user code, you know exactly where to find it. Everything related to users lives in one place. The tradeoff is you'll have many files with the same name, which can make searching less convenient.
Both are solid choices. My preference is the model-based approach because it makes finding code easier. When working on a feature, all the related code is grouped together rather than scattered across different directories. This structure also makes sharing data between related modules simpler, as you can keep data models and handlers close together.
## Learning Resources
If you're serious about Rust web development, read these books in order:
Start with **"The Rust Programming Language"** (The Book). This is your foundation. Don't skip it.
Next, read **"Code like a Pro in Rust"** by Brenden Matthews. Skip directly to the HTTP REST API chapter once you've finished The Book. It bridges the gap between knowing Rust and building web services.
Then dive into **"Zero to Production in Rust"** by Luca Palmieri. This book is opinionated and comprehensive, with a strong focus on test-driven development and professional practices. It covers real-world deployment considerations you won't find elsewhere. This is the deep dive into production-grade backend development.
For practical examples, check out the Realworld Axum SQLx implementation on GitHub [launchbadge/realworld-axum-sqlx](https://github.com/launchbadge/realworld-axum-sqlx). It's a complete application showing how these pieces fit together.
## Deployment Options for Your Web Application
**VPS Hosting** is the most common way to deploy web applications. It's a machine that you have full control over. You can add or remove any software on the VPS that you want (or don't want!) to use. However, you'll have to manage everything: load balancing, SSL certs, building, deploying, CI/CD. It can be a pain, but you'll have full control. Both vertical and horizontal scaling becomes a challenge.
**Containers** are more reliable and portable than deploying directly to a VPS. It's better to deploy as a container rather than directly running on the host machine. It's more predictable and you'll avoid the "it works on my machine" issue. Docker and containerization give you reproducible deployments and easier rollbacks and better isolation and security.
For production scale, **Kubernetes** or **ECS** provide the orchestration you'll eventually need. This is more enterprise scale and it can be quite expensive. It still needs a whole lot of managing and a dedicated team. Don't start there unless you already have that infrastructure and the wherewithal to manage it.
**Shuttle** is the easiest choice. It's easy to build, deploy, and get SSL certs. You'll just add a macro to your main function and run `shuttle deploy`, and everything will be handled for you: SSL certs, database included (will be provisioned automatically). It offers a generous free tier and works with any Rust web framework (even your own custom one). For Rust web applications, this is the fastest path to production. Developers can create and deploy projects in minutes. The downside is it only works for Rust at the moment.
You can [read the Shuttle documentation](https://docs.shuttle.dev/) for more information about how to deploy a Rust web app to Shuttle.
## Common Pitfalls & Trade-offs
### Async Complexity
There's a common misconception that async is always necessary. Jim Blandy's benchmarks show context switching costs are measured in nanoseconds. For most applications, the majority of CPU time should be spent executing business logic, not managing async overhead. If your application is compute-heavy rather than I/O-bound, a synchronous framework might be simpler and just as fast.
### Choice Paralysis
Unlike Go's "batteries included" philosophy, Rust requires upfront decisions about your stack. This can feel overwhelming initially. The good news is that the ecosystem has matured significantly. Community consensus exists around solid options for backend frameworks, databases, templating engines, and deployment strategies. The frameworks I've recommended here are all production-ready and well-supported, making it easier for developers to implement their projects with confidence.
### Frontend Maturity
The backend story is excellent. Rust backend frameworks are production-ready today. The frontend WASM story is still maturing. Yew has "grown quite nicely" according to its maintainers, but developers should be cautious about using Rust WASM frameworks like Yew or Perseus for production applications unless you've validated they meet your specific needs.
The pragmatic approach is to use what works today: HTMX with server side rendering, or a mature JavaScript framework like React for your frontend while leveraging Rust's strengths on the backend to handle API requests and create robust server-side logic.
## Putting It All Together
Here's the stack I recommend for most Rust web applications:
**Backend:** Axum for its balance of power and approachability.
**Database:** SQLx with PostgreSQL for flexibility and reliability.
**Templating:** Tera for server-side rendering.
**Frontend:** Start with server side rendering and HTMX. Add WASM later only if you have a specific need.
**Deployment:** Shuttle for the fastest path to production, with deployment in five minutes using `shuttle deploy`.
This stack is production-ready, well-documented, and supported by active communities.
## Conclusion
Rust web development requires more upfront research than alternatives like Go or Python. You're making architectural decisions that other ecosystems have made for you. But the payoff is significant: exceptional performance, memory safety guarantees, and predictable runtime behavior. Developers who invest the time to learn Rust will create more efficient and reliable web applications.
The ecosystem offers mature, well-documented options for backend development. Choose tools based on your actual requirements rather than hype. Start simple and add complexity only when you need it.
The performance and reliability benefits of Rust pay off for production applications, especially when you're building microservices or processing large amounts of data. The initial investment in learning and choosing your stack will pay dividends as your application scales.
## Get Started
```bash
# Get started quickly with Shuttle
shuttle init --template axum
```
This single command scaffolds a working Axum application with a proper project structure. From there, you're minutes away from a deployed web service. You can then implement your business logic and create the features your application needs.
## Frequently Asked Questions
---
# Testing Cursor Composer: The AI Coding Model Built for Speed
Source: https://www.shuttle.dev/blog/2025/11/05/cursor-composer-hands-on
Date: 5 November 2025
Author: dcodes
Tags: ai, composer, cursor, development
I spent a day testing Cursor Composer to find out what it's actually good at. Here's what I learned about its speed, capabilities, and limitations.
Cursor released their new AI coding model (Composer) last week. The main pitch is speed - turning natural language into working code faster than before. I wanted to see what it's actually good at, so I spent some time putting it through different scenarios.
Cursor claims this model to be a competitive AI close to the most frontier models in intelligence, which is why I wanted to test it out, it's the first time we have a model that can compete in both speed and intelligence.
I tested Composer across a few key areas: executing tasks of varying complexity, searching codebases and documentation, and planning. These are common software engineering tasks that developers face daily. I'll walk through what worked and what didn't.
## Simple Coding Tasks: Building a REST API with Cursor
I started with a straightforward prompt to build a REST API in Rust with CRUD operations:
It executed the entire task in 20 seconds, writing the code and running `cargo check` to verify everything compiled without any errors.
First time trying this, I didn't expect it to be this fast! I mean I expected it to be fast, but not _this fast_ 🙂.
Gave Composer a broad instruction and let it choose whatever framework it thinks best. It chose Axum _obviously_ as every model seems to be using it these days.
The code compiles without warnings and the server app is ready to run on port 3000.
For developers doing this 3 years ago, it would mean hours of work, especially if you were new to Rust. Twenty seconds from natural language instructions to working code without any compiler errors is bonkers. No runtime errors as well.
I tested all the endpoints - creating tasks, listing them, getting by ID, updating, and deleting. Everything works exactly as it should.
Okay, this task was very simple: It was a completely new repository with no existing code, no complexity to make difficult decisions, we'll try something a little bit harder in the last section.
## Codebase Search: Finding Relevant Files with Cursor's AI
Before planning my tasks when developing features, sometimes I do a codebase search using a fast model to find the relevant file paths for a specific task that needs to be implemented. Then, I'll use the results to plan out the task using a more intelligent model, this helps in speeding things up and saving tokens. So, let's try and do exactly that with Cursor's Composer.
I tested this with a real GitHub issue from the [shuttle-hq/shuttle](https://github.com/shuttle-hq/shuttle) repository. The task was to add a `--quiet` flag to suppress non-error output from the `shuttle run` command. I wanted to see how fast Cursor's Composer can find all the relevant files in the codebase.
Composer scanned the entire codebase and returned results in 15 seconds:
Everything was spot on, and only in 15 seconds. _Crazy fast and crazy good_.
## From Search to Strategy: Creating an Implementation Roadmap
Creating plans is a common process when developing software. Let's see if Composer can take those search results and create an implementation plan? I started a fresh chat and fed it the issue description along with all the file paths and locations it had just found.
Composer generated a well-structured plan:
The plan included an overview, clear implementation steps, specific file locations with line numbers, and code examples showing exactly what needs to be added. It broke down the task into logical steps, pretty much like any other AI model would do.
The structure looks solid, but the real test is execution and I don't really know if the approach is actually good or not. So, let's see if Composer can complete the task.
## Complex Tasks: Implementing the Solution
Opened a new chat and fed Composer the implementation steps and asked it to implement the changes. It completed the task in 40 seconds, making changes across multiple files.
But speed doesn't matter if the code doesn't work. Time to review what it actually did.
The code review looked clean. Cursor's reviewer agent didn't flag any issues either. The implementation added the quiet field to the `RunArgs` struct, properly wrapped the print statements, and compiled without errors.
I created a new Shuttle project using the official Shuttle Axum template. Then, I verified the flag works as expected by running `shuttle run` without the flag:
All the build logs, runtime startup messages, and info logs appear - the default behavior. Now with `shuttle run --quiet`:
The build logs from cargo-shuttle disappeared. Only runtime logs remain visible. Exactly what the issue asked for - suppress non-error output from cargo-shuttle while keeping the runtime output.
Perfect. The implementation works.
## Final Thoughts: Natural Language to Code at Speed
After testing Composer across different scenarios, here's what I think about it:
**Codebase search:** Excellent. This is where Composer really excels. Fifteen seconds to scan an entire repository and find every relevant file with specific line numbers is incredibly useful.
**Simple to medium tasks:** Really good. The in-memory REST API took 20 seconds and worked perfectly. The GitHub issue implementation worked across multiple files in 40 seconds. For well-defined tasks with clear requirements, it can generate and deliver fast, working code.
**Complex architectural decisions:** I wouldn't trust it here. For tasks that require deep technical reasoning, evaluating tradeoffs, or making non-obvious choices, you want a more capable model like Sonnet 4.5.
The practical takeaway for software engineering is that Composer gives us an AI tool that's both fast and smart enough for real work. That's a useful combination. I can see developers using Composer every day - searching codebases, making config changes, implementing straightforward backend or frontend features. The kind of tasks where waiting 1min+ for a heavier model feels unnecessary.
It's not about replacing more intelligent models. It's about having the right tool for different jobs. For quick, well-scoped tasks, this approach gets you from natural language instructions to working code faster than anything else I've tried.
## Conclusion: The Future of AI-Assisted Development
Speed matters in modern software engineering and development work. Cursor's new AI coding assistant (Composer) proved it can handle everyday tasks - searching codebases, implementing features, fixing bugs - in seconds rather than minutes. It's not perfect for everything, but it doesn't need to be. Having a fast model that's reliable for common software development tasks changes how I think about using AI tools in my workflow.
Get started with our backend API template and let us know what you'll build with Composer:
```bash
shuttle init --template axum
```
---
# Cursor 2.0 is Out! Here is What's New
Source: https://www.shuttle.dev/blog/2025/10/31/cursor-2.0
Date: 31 October 2025
Author: dcodes
Tags: cursor, v2, ai, development
Cursor 2.0 brings their first coding model Composer, a reimagined agent-first interface, built-in browser testing, and parallel multi-agent workflows that change how we build software.
Cursor just released version 2.0 with a major update introducing a new agent model **Composer** and a redesigned interface built around agentic workflows. Composer's speed particularly stands out especially when its intelligence is close to frontier models.
Beyond the new model, the interface has been rebuilt to treat agents as the primary way you interact with your codebase rather than files. In this article, we'll go over the most important new features and how they change the way you work with AI-assisted coding.
## Composer: Built for Speed
Probably the most exciting new feature is the new model **Composer** which is Cursor's first competitive coding model, and it's designed specifically for low-latency agentic coding. The claim is 4x faster than similarly intelligent models, with most tasks completing in under 30 seconds.
The performance is the most interesting to me, I've lost count of how many times I've been waiting for a model to complete a relatively simple task only for me to lose patience and do it manually. Not all tasks are complex, not all tasks require _ultrathinking_ and not all tasks require _state of the art_ intelligence.
When you're iterating on a feature, waiting 2 minutes versus 30 seconds compounds quickly. Fast feedback loops change how you think about using AI assistance.
With that being said, **Composer** is still close to frontier models in terms of intelligence as well, so you'll get the best of both worlds (hopefully).
Interestingly, Composer was actually running in Cursor for a while under the name "Cheetah" before this official release.
One particularly clever detail: Composer was trained with codebase-wide semantic search as a core tool, making it significantly better at navigating and understanding large codebases. It can also edit multiple files in parallel, which is wild when you see it in action.
## Agent-First Interface
The new interface is a complete departure from traditional IDE layouts. The core idea of this new interface is to focus on outcomes and let agents handle the details.
You can quickly switch between the agent-focused view and the classic IDE view by clicking the "Agents" button in the top left corner.
## Running Multiple Agents in Parallel
Cursor 2.0 lets you run multiple agents in parallel without them stepping on each other's toes. Under the hood, this uses git worktrees or remote machines to isolate each agent's workspace.
The idea here is to run the same task across multiple models simultaneously and compare results. For harder problems, this _"bake off"_ approach can potentially produce a better final output than relying on a single model.
## Built-In Browser Testing
One of the most practical additions is the native browser tool. Instead of constantly switching between your IDE and browser when working on web applications, the browser lives right inside Cursor. More importantly, agents can interact with it directly.
This means an agent can make changes to your code, test them in the browser, see what broke, and iterate until it works. That feedback loop happening automatically is genuinely useful, especially for frontend work where visual verification matters.
## Review Changes
As agents do more coding, reviewing their output becomes the real job. Cursor 2.0 introduces a dedicated review interface that makes it much faster to scan through what changed and dive deeper when something looks off. It's not revolutionary, but it's a thoughtful addition that shows they're thinking about the actual workflow, not just generating code.
## Voice Mode
Voice mode lets you speak your intentions and have them turned into code. Essentially Speech-to-Code, it's good to see that it's finally here.
## Pricing
The pricing structure remains competitive with other AI coding tools. Composer could be one of the best models for the price, especially given its speed to intelligence ratio.
## What This Means
Cursor 2.0 feels like a bet on a specific future: one where you spend more time directing multiple AI agents and less time writing code manually. Whether that's the future you want is a different question entirely.
For teams that are all-in on AI-assisted development, Cursor 2.0 provides some genuinely useful capabilities. The speed of Composer, the parallel agent workflows, and the built-in browser testing address real pain points that emerge when you're heavily using AI coding tools.
The question is whether this agent-first approach becomes the standard way we build software, or if it ends up being a power feature that most developers occasionally use while sticking primarily to traditional file-based editing. Time will tell.
Join our Discord and let us know what you think about Cursor 2.0!
---
# How to Build a Streamable HTTP MCP Server in Rust
Source: https://www.shuttle.dev/blog/2025/10/29/stream-http-mcp
Date: 29 October 2025
Author: dcodes
Tags: rust, mcp, http, sse, shuttle, ai
Learn how to build and deploy a task manager MCP server using streamable HTTP transport in Rust. This guide covers the MCP protocol, real-time updates with SSE, and deployment to Shuttle for production use.
[Local MCP servers](https://www.shuttle.dev/blog/2025/07/18/how-to-build-a-stdio-mcp-server-in-rust?utm_source=shuttle_blog&utm_medium=blog&utm_campaign=http_stream_mcp_server&utm_content=intro_link) are great, but they come with friction. Users need to install them on their machines, have the right runtimes (Python, Node.js, etc.) with compatible versions, and manually update them when new versions are released. Tools like `npx` can help with this, but it's still an extra step.
There's also the trust factor. Local MCP servers can execute code on your machine, so you're essentially giving the authors system-level permissions. That requires a high degree of trust.
HTTP MCP servers or _Remote MCP servers_ sidestep these issues. Instead of running code locally, your MCP client communicates with a live URL. No installation required. Updates happen server-side, and the trust model is simpler since the server can't touch your local machine.
Streamable HTTP is the successor to the older HTTP+SSE transport from protocol version 2024-11-05. The current protocol revision (2025-03-26) offers improved flexibility for both basic and feature-rich servers with **streaming** capabilities.
In this guide, we'll build a task manager MCP server using _streamable HTTP_ transport. The server demonstrates session-based communication with Server-Sent Events (SSE) for streaming updates from server to client, and HTTP POST requests for client-to-server messages.
## Understanding Streamable HTTP Transport
Streamable HTTP works through session-based communication. During initialization, the server assigns a **session ID** and returns it in the `Mcp-Session-Id` header. Clients send messages through HTTP POST requests, and servers can respond in two ways:
- Direct JSON response (`application/json`) for simple operations
- SSE stream (`text/event-stream`) for operations requiring multiple updates or server-initiated messages
Clients also maintain a dedicated SSE connection via HTTP GET to receive server-initiated messages between POST requests.
In our task manager example, the flow works like this: when a client (like Cursor) sends a POST request to add a task, the server processes it and can immediately push the result back through an SSE stream. The client maintains an open connection listening for these events, receiving real-time updates as tasks are added or completed. This means the AI agent doesn't need to poll for changes-it gets notified instantly when something happens on the server.
For details on other transport types and the complete specification, see the [MCP documentation](https://modelcontextprotocol.io/specification/2025-03-26/basic/transports).
## Building a Streamable HTTP MCP Server
In this guide, we'll build a task manager MCP server that keeps track of tasks and allows you to add, complete, list, and retrieve tasks with real-time updates. The task manager implemenation is relatively simple, but it demonstrates the core patterns for building streamable HTTP MCP servers.
> Note: This project is designed for learning and demonstration purposes. It doesn't follow production best practices like proper error handling, authentication, or persistent storage. For production use, you'd want to add these features.
### Project Setup
We'll need the official [RMCP crate](https://crates.io/crates/rmcp) made by the [modelcontextprotocol.io](https://modelcontextprotocol.io/) team.
Create a new project and add the dependencies:
```toml
[dependencies]
tokio = { version = "1", features = ["full"] }
rmcp = { version = "0.8", features = [
"server",
"macros",
"transport-streamable-http-server",
] }
axum = "0.8"
serde = { version = "1", features = ["derive"] }
serde_json = "1"
schemars = "1.0"
tracing = "0.1"
tracing-subscriber = { version = "0.3", features = ["env-filter"] }
```
The `rmcp` crate with the `transport-streamable-http-server` feature provides everything we need for building streamable HTTP servers. We'll also use the `axum` framework for handling HTTP requests and responses and it integrates seamlessly with the `rmcp` crate.
### Task Manager Implementation
First, we'll define the task structure and the manager that holds our state:
```rust
#[derive(Debug, Clone, Serialize, Deserialize)]
struct Task {
id: usize,
title: String,
description: String,
completed: bool,
}
#[derive(Debug, Clone)]
struct TaskManager {
tasks: Arc>>,
next_id: Arc>, // Counter for generating unique task IDs
tool_router: ToolRouter,
}
```
`Arc>` ensures thread-safe access to our shared state-multiple clients might be connected simultaneously, and this pattern handles concurrent operations safely. The `next_id` counter increments each time we create a task, giving each one a unique identifier.
The `tool_router` (type `ToolRouter` from the `rmcp` crate) handles routing incoming tool calls to the appropriate methods we'll define below.
### Implementing MCP Tools
The `#[tool_router]` and `#[tool]` macros make defining MCP tools straightforward. RMCP handles all the protocol specifications behind the scenes, so we just need to focus on implementing our tools.
You'd implement the tools just like how you would do it in any other Rust project, write your code and let the macros handle the rest. Here's how I implement the `add_task` tool:
```rust
#[tool_router]
impl TaskManager {
fn new() -> Self {
Self {
tasks: Arc::new(Mutex::new(Vec::new())),
next_id: Arc::new(Mutex::new(1)),
tool_router: Self::tool_router(),
}
}
#[tool(description = "Add a new task to the task manager")]
async fn add_task(
&self,
Parameters(AddTaskRequest { title, description }): Parameters,
) -> Result {
let mut tasks = self.tasks.lock().await;
let mut next_id = self.next_id.lock().await;
let task = Task {
id: *next_id,
title: title.clone(),
description,
completed: false,
};
*next_id += 1;
tasks.push(task.clone());
let response = serde_json::json!({
"success": true,
"task": task,
"message": format!("Task '{}' added successfully with ID {}", title, task.id)
});
Ok(CallToolResult::success(vec![Content::text(
serde_json::to_string_pretty(&response).unwrap(),
)]))
}
}
```
The `Parameters` wrapper automatically validates and deserializes the input based on the request structure:
```rust
#[derive(Debug, Deserialize, schemars::JsonSchema)]
struct AddTaskRequest {
#[schemars(description = "The title of the task")]
title: String,
#[schemars(description = "A detailed description of the task")]
description: String,
}
```
The `schemars` descriptions help AI agents understand what each parameter means, improving their ability to use the tools correctly.
I've implemented similar tools for completing tasks, listing all tasks, and retrieving specific tasks by ID. Each tool follows the same pattern: validate input, perform the operation, return structured results.
### Server Handler Implementation
The `ServerHandler` trait defines server metadata and capabilities. Every MCP server must implement this trait to be compliant with the MCP protocol, the AI agents will query this metadata to understand what the server is used for and which specification version it supports.
> In a real life project you'll want to be more descriptive with the server metadata and capabilities, but for the sake of this guide we'll keep it simple.
```rust
#[tool_handler]
impl ServerHandler for TaskManager {
fn get_info(&self) -> ServerInfo {
ServerInfo {
protocol_version: ProtocolVersion::V_2025_03_26,
capabilities: ServerCapabilities::builder()
.enable_tools()
.build(),
server_info: Implementation {
name: "task-manager".to_string(),
version: "0.1.0".to_string(),
title: None,
website_url: None,
icons: None,
},
instructions: Some(
"A task manager MCP server that allows you to add, complete, list, and retrieve tasks with real-time updates."
.to_string(),
),
}
}
}
```
Setting up the MCP service is as easy as that. Now we need to wire everything together and serve it over HTTP, and for that we'll use the `axum` framework which integrates seamlessly with the `rmcp` crate.
## Serving the MCP Server over HTTP
With our task manager service defined, the final step is creating the HTTP server that exposes it. We'll configure logging with `tracing`, initialize our `StreamableHttpService` with the `TaskManager`, and start an Axum server to handle incoming MCP requests over HTTP.
```rust {11-15, 17}
#[tokio::main]
async fn main() -> anyhow::Result<()> {
tracing_subscriber::registry()
.with(
tracing_subscriber::EnvFilter::try_from_default_env()
.unwrap_or_else(|_| "info".to_string().into()),
)
.with(tracing_subscriber::fmt::layer())
.init();
let service = StreamableHttpService::new(
|| Ok(TaskManager::new()),
LocalSessionManager::default().into(),
Default::default(),
);
let router = axum::Router::new().nest_service("/mcp", service);
let tcp_listener = tokio::net::TcpListener::bind("127.0.0.1:8000").await?;
tracing::info!("Server ready at http://127.0.0.1:8000/mcp");
axum::serve(tcp_listener, router)
.with_graceful_shutdown(async {
tokio::signal::ctrl_c().await.unwrap();
})
.await?;
Ok(())
}
```
The service factory `|| Ok(TaskManager::new())` creates a new instance for each session. This means each connected client gets their own isolated task list-tasks added by one client won't appear in another client's list. For a production task manager, you'd likely want shared state across sessions using a [database](https://docs.shuttle.dev/resources/shuttle-shared-db?utm_source=shuttle_blog&utm_medium=blog&utm_campaign=http_stream_mcp_server&utm_content=database_resource).
`LocalSessionManager::default()` handles all the session lifecycle management. It creates sessions, routes messages to the correct connections, and cleans up when clients disconnect.
### How Messages Flow
In our task manager, the client establishes a persistent SSE connection via GET request to listen for updates. When the client sends a POST request to add or complete a task or run any other MCP tool, the server processes it and pushes the result back through that established SSE stream in real-time. This way the client receives instant notifications without polling.
## Testing with MCP Inspector
Now that everything is set up, you can run it locally:
```bash
cargo run
```
Now the server is ready, add it to your MCP client - in my case I'll use Cursor.
```json
{
"mcpServers": {
"Tasks": {
"url": "http://127.0.0.1:8000/mcp"
}
}
}
```
Let's try it out, I'll ask the AI agent to add a few tasks and run all the other MCP tools to see how it works.
Perfect! 🎉 Everything works as expected.
With the task manager running and integrated into Cursor, you have a fully functional MCP server handling real-time task operations through streamable HTTP.
This works perfectly for local development, but in real applications you'll want your server accessible from anywhere so users can connect to it. In the next section, we'll deploy to Shuttle to get a public URL.
> Make sure you read the [security warnings](https://modelcontextprotocol.io/specification/2025-03-26/basic/transports#security-warning) before deploying your MCP server to production.
## Deploying Your MCP Server to the Cloud
In order to deploy your MCP server to Shuttle, you'll need to install the Shuttle crates. At the moment the latest versions are `0.57` but make sure to check the [latest Shuttle versions here](https://github.com/shuttle-hq/shuttle/releases).
```toml
[dependencies]
shuttle-runtime = "0.57"
shuttle-axum = "0.57"
```
Update your `main.rs` file to use Shuttle:
```rust {1-2, 15}
#[shuttle_runtime::main]
async fn main() -> shuttle_axum::ShuttleAxum {
// Bind Address variable no longer needed. Shuttle will handle the binding for us.
tracing::info!("Starting Task Manager MCP Server");
let service = rmcp::transport::streamable_http_server::StreamableHttpService::new(
|| Ok(TaskManager::new()),
rmcp::transport::streamable_http_server::session::local::LocalSessionManager::default()
.into(),
Default::default(),
);
let router = axum::Router::new().nest_service("/mcp", service);
Ok(router.into())
}
```
We removed `tracing_subscriber` as well, because Shuttle has it's own logging system and it's already configured for us.
Migrating to Shuttle is as simple as that. Run your project locally to see it working with `shuttle run`.
```bash
shuttle run
```
Perfect! 🎉 Your MCP server is now running locally using Shuttle.
### Shuttle Deploy
Make sure you're logged in to Shuttle first to deploy, you'll need to [create an account](https://console.shuttle.dev?utm_source=shuttle_blog&utm_medium=blog&utm_campaign=http_stream_mcp_server&utm_content=create_account) and run `shuttle login` first.
We'll need a Shuttle project first:
```bash
shuttle project create --name task-manager-mcp-server
```
Then deploy with the following command:
```bash
shuttle deploy --name task-manager-mcp-server
```
Perfect! 🎉 Your MCP server is now deployed to Shuttle.
Update your `mcp.json` file to use the new project URL:
```json
{
"mcpServers": {
"Tasks": {
"url": "https://task-manager-mcp-server-djf4.shuttle.app/mcp"
}
}
}
```
## Next Steps
This task manager demonstrates the core patterns for building streamable HTTP MCP servers. The same approach scales to more complex scenarios like [database integration](https://docs.shuttle.dev/resources/shuttle-shared-db?utm_source=shuttle_blog&utm_medium=blog&utm_campaign=http_stream_mcp_server&utm_content=next_steps) or external API calls.
One of the best parts about HTTP MCP servers is the deployment story. Your users don't need to install anything locally or manage dependencies - they just add your server's URL to their `mcp.json` and it works. This makes distribution and updates simple since you control the server and everyone automatically gets the latest version.
You can download the complete project from the following command:
```bash
shuttle init --from shuttle-hq/shuttle-examples --subfolder mcp/http-stream-mcp
```
And deploy to Shuttle:
```bash
shuttle deploy
```
Happy Coding!
---
# Launching an Army of Haiku 4.5 Agents
Source: https://www.shuttle.dev/blog/2025/10/23/using-haiku-4.5-agents
Date: 23 October 2025
Author: dcodes
Tags: ai, claude, haiku, agents
Using Sonnet 4.5 as an orchestrator to deploy multiple Haiku 4.5 agents in parallel. We build a new CLI feature for the Shuttle repository to demonstrate how parallel agent orchestration handles complex tasks faster and more cost-effectively.
Last week, Anthropic launched Haiku 4.5, their newest and most capable small model yet. It matches Claude Sonnet 4's coding performance which used to be the best model just a few months ago, outperforms it in certain tasks like computer use, runs at more than twice the speed, and costs one-third as much.
The numbers look good on paper, but does this actually work in practice? Anthropic recommends using Haiku 4.5 through a parallel orchestration approach - Sonnet 4.5 breaks down complex problems and does the planning while multiple Haiku 4.5 agents handle subtasks in parallel.
One of the great advantages of spawning agents by the main agent is that each agent will have it's own context window and they will have a clean context to work with because they will not automatically add `CLAUDE.md` files to their context window. They operate only based on the instructions given to them by the main agent. This also means that your main agent's context window will not be cluttered with old context from the workers and it will only get the summarized details from each worker agent, this way you'll have a more efficient main agent as well.
To demonstrate this in action, we're working with the official [Shuttle repository](https://github.com/shuttle-hq/shuttle). This is a real production codebase that's been actively developed and maintained over the years. It's the perfect testbed for putting Haiku 4.5 to the test because the repository has a lot of code and is a good example of a large codebase that can be used to demonstrate this approach.
In this blog post, we'll use this method to build a new feature for the Shuttle CLI. We'll explain the feature to Sonnet 4.5 and let it plan the implementation, then launch multiple Haiku agents to execute the plan in parallel, and see what we learn from applying it to a real codebase.
## The Feature: AI Rules Command
The feature we're building is a new CLI command that helps developers set up AI rules for Shuttle for their code editor. Different editors like Cursor, Claude Code, and Windsurf use these files to provide context to their AI assistants. The command `shuttle ai rules` will interactively ask which editor you're using, or accept arguments like `shuttle ai rules --claude` to skip interaction.
This helps AI agents to understand how Shuttle works and how to use it. Giving proper context and instructions to avoid hallucinations and improve accuracy.
We have a `ai-rules.md` file that contains the context required for the AI agents to understand how Shuttle works and how to use it. And when the command runs, a file will be created with the content of the `ai-rules.md` file in the corresponding editor's rules directory.
## Creating a Worker Agent
First, I create a worker agent by running `/agents` in Claude Code and describing its purpose:
The prompt is simple: "A worker agent that's not very smart but it can get things done if the task isn't too complex and enough context is given."
This explanation sets the expectations for the orchestrator when launching agents to not offload too complex tasks to the workers.
Next, select Haiku 4.5 as the model:
Perfect! Our worker agent is ready to use!
## The Prompt: Building a New CLI Feature
I'll enter this prompt in plan mode, which lets Sonnet think through the approach before executing. Here's the prompt I'm giving to Sonnet to build a new feature for the Shuttle CLI:
The prompt includes everything Sonnet needs to know: what to build, how to research the existing codebase patterns, the interactive flow, and the argument handling.
In plan mode, Sonnet spawns the built-in "Explore" agent (powered by Haiku) to search for existing interactive implementations, analyze the CLI structure, and gather context. This is another great use of the Haiku model - it's fast and efficient for codebase exploration.
## Minimizing Ambiguity
After searching the codebase, Claude doesn't immediately write the plan. Instead, it finds some ambiguity and asks clarifying questions:
This is a newer feature in Claude Code that sets it apart from many other coding agents. Most AI coding tools are goal-oriented - they try to complete the task no matter what, often making assumptions that lead to side effects or inaccurate implementations. Claude Code takes a different approach. When it encounters ambiguity, it stops and asks questions.
After answering the questions, Claude has everything it needs:
The answers clarify the remaining ambiguities - skip VSCode since it doesn't have native AI rules support, use `.windsurf/rules/shuttle.md` for Windsurf, bundle the ai-rules.md into the CLI binary, and make it work from any directory. With this context locked in, Claude is ready to create the implementation plan.
This is exactly what I wanted. The plan covers both interactive and non-interactive flows, includes key implementation points like using `ColorfulTheme::default()` to match existing patterns, and even outlines a testing approach. The planner looked at the codebase, understood the existing conventions, and created a plan that fits naturally into the project.
Now that the plan is ready, let's start launching the Haiku agents.
## Running Tasks in Parallel
To make Claude run multiple agents in parallel, you need to tell it explicitly. After reviewing the plan, I added a simple instruction: _"Use multiple @agent-task-worker agents to handle each task in parallel."_ This tells Sonnet to spawn multiple _task-worker_ agents (the Haiku 4.5 agents we configured earlier) and distribute the implementation tasks across them, executing them concurrently instead of sequentially.
## The Army Executes
You can see three Haiku-powered task-worker agents running simultaneously - one updating `args.rs` with the AI command, another creating the `ai.rs` module implementation, and a third updating `lib.rs` to wire the AI command into the CLI. Each agent is reading files, running cargo checks, and making progress on its assigned task independently. Sonnet orchestrates while multiple Haiku agents execute the implementation in parallel.
The orchestrator prevents conflicts by assigning non-overlapping files and including necessary context about dependencies in each agent's instructions. When Agent A needs types that Agent B is creating, Sonnet provides those definitions upfront. If something breaks, the orchestrator detects it and adjusts. But it still remains my main concern when launching many agents in parallel.
## The Result
The agents finish writing their code. Then Sonnet takes over, testing the CLI and handling all the edge cases. Everything works exactly as requested.
All the success criteria pass. The new `shuttle ai rules` command works in both interactive and non-interactive modes, bundles the ai-rules.md content into the binary, handles platform-specific file paths correctly, and works from any directory.
This would've taken hours if done manually - learning the codebase, finding patterns, handling the interactive flow and file operations. The _Explore_ agents gather context about the codebase structure and conventions, Sonnet plans the implementation, and _task-worker_ agents execute it.
## When to Use Which Model
| Use Haiku When | Use Sonnet When |
| -------------------------------------------- | ----------------------------------------------- |
| Exploring codebases or gathering context | Orchestrating multiple sub-tasks |
| Task is well-defined with clear requirements | Problem requires complex reasoning or planning |
| Following existing code patterns | Making architectural decisions |
| Implementing specific features from a plan | Breaking down ambiguous requirements |
| Writing tests or documentation | Testing implementations and handling edge cases |
| Task can run in parallel with others | Need sequential decision-making |
| Cost and speed matter more than complexity | Accuracy matters more than speed |
Haiku excels at execution when you know what needs to be done. Sonnet excels at figuring out what needs to be done. Use Sonnet to plan and orchestrate, then spawn Haiku agents for codebase exploration and implementation to execute the plan.
## Conclusion
This approach changes how we think about AI-assisted development. Instead of a single model grinding through every task sequentially and bloat the context window, Sonnet 4.5 acts as an intelligent orchestrator while Haiku 4.5 agents handle the execution in parallel, the main agent's context window remains clean throughout the coding session. The result is faster, cheaper, and more accurate than either model working alone.
Throughout the blog, we saw multiple use cases of using Haiku agents, they're not just great for execution, but also for exploration and gathering context.
Give Sonnet one comprehensive prompt in plan mode, let it research the codebase by spawning Explore agents, clarify any ambiguities through questions, then spawn worker agents to execute in parallel.
While this worked for me in this particular example, it might not always be the case and there could be specific scenarios where this approach might not be the best fit.
Start building your applications and deploy to Shuttle in 5 minutes with our Rust & Axum template.
```bash
shuttle init --from shuttle-hq/shuttle-examples --subfolder axum/ai-assisted
```
---
# Shuttle Raised $6M Seed to Build the AI Platform Engineer
Source: https://www.shuttle.dev/blog/2025/10/22/shuttle-raises-6-million
Date: 22 October 2025
Author: shuttle
Tags: funding, announcement, ai, deployment
Shuttle announced $6M in seed funding to build the AI platform engineer that helps developers deploy backends as fast as they code them with AI assistance.
Today, we're announcing that Shuttle has raised $6 million to accelerate our mission: make building and operating backends as simple as writing code with AI. In short, Shuttle is the AI platform engineer, helping builders go from idea to production in minutes.
[TechCrunch covered our announcement](https://techcrunch.com/2025/10/22/shuttle-raises-6-million-to-fix-vibe-codings-deployment-problem/) as well - check out their story on how we're fixing the "vibe coding" deployment problem.
Our goal is to be the go-to cloud infrastructure platform for developers building with tools like Cursor and GitHub Copilot. As AI accelerates coding, infrastructure has become the bottleneck. Our mission has always been to remove it.
To get there, we've raised $6M from world-class partners and operators, including:
- Y Combinator
- Global Founders Capital
- Thomas Dohmke, former CEO of GitHub
- Calvin French-Owen, Founder of Segment
- Senior leaders from OpenAI, Deel, Confluent, and others
Our vision is simple: Backends must be as composable and understandable as code to unlock the next wave of AI-assisted development.
"In the era of AI, developers are writing apps faster than ever with the help of coding agents like GitHub Copilot or Claude Code. Deploying and running these applications as fast as creating them is the next major frontier," said Thomas Dohmke, former CEO of GitHub. "And Shuttle is uniquely positioned to be a leader in this space and enable quick iteration cycles for every full-stack builder."
## Why now?
AI is changing how software is built. Developers are becoming orchestrators who prompt systems to generate code, wire APIs, and scaffold products. As a result, the amount of code being generated and pushed to production has exploded, but the backend, with all the queues, storage, networking, security, and deployments, still takes days of work to make it real.
The definition of "developer" is expanding to include people who may not come from traditional engineering backgrounds. This shift means more individuals are now building and deploying software than ever before. This not only means our audience is getting bigger - it also makes the need for simpler, more accessible infrastructure greater than ever.
This is where Shuttle comes in. We are building an AI-native, language-agnostic platform where code and infrastructure live together and are reviewable by people and AI.
## What we've proven so far
We started in Rust, where developers demanded performance and a great developer experience. Shuttle is now one of the top choices for deploying Rust backends in minutes. It is used by tens of thousands of developers, and recently crossed 130,000 deployments. Teams describe Shuttle as "Vercel for backends," and our PMF survey shows strong resonance: 60% of developers would be "very disappointed" if they could no longer use Shuttle. We have also built an active and engaged community around our mission.
## What this funding enables
We're taking the zero-config experience that Rust developers love and bringing it to every language. We are also making the Shuttle experience even more integrated with the AI coding workflows. In other words, we're building the expert co-pilot that provisions and wires your entire cloud stack for you.
Imagine a compact infrastructure-as-data spec that is entirely language-agnostic. With seamless integrations, you'll be able to deploy applications from within Cursor or with the help of Claude Code or GitHub Copilot. No YAML, no Terraform, no CI glue. Use this to deploy to AWS, GCP, or your own cloud with opinionated defaults and guardrails. We will provide reusable backend patterns for APIs, jobs, queues, vector stores, and more. And if you're building within a team, you will be able to spin up preview environments, and get granular access control, cost and architecture suggestions.
We're launching the Beta of our new platform in the upcoming weeks. Stay tuned for more updates and get in touch via [Discord](https://discord.com/invite/shuttle) or email if you want to know more!
---
# From Push to Production: Deploy from GitHub with Shuttle
Source: https://www.shuttle.dev/blog/2025/10/21/github-integration
Date: 21 October 2025
Author: shuttle
Tags: github, deployment, ci-cd, automation, rust
Deploy Rust applications directly from GitHub to Shuttle with automatic builds and deployments. No CLI, no manual redeploys - just git push and go.
If you're building in Rust, chances are you spend more time crafting elegant code than thinking about deployments and that's exactly how it should be.
At Shuttle, we believe deploying your Rust application should feel as natural as writing it. That's why we've built a new **GitHub integration** feature that takes you from _push_ to _production_ automatically.
No manual redeploys. No juggling CLI commands. Just push your code to GitHub, and we'll handle the rest. 🚀
## Why It Matters
Every developer knows the drill, push code, switch to your deploy tool, trigger a build, wait, fix a config, deploy again. It's not exactly the smoothest workflow.
With the new **Shuttle + GitHub** integration, that entire process collapses into one seamless step: **git push**.
When you connect your GitHub repository to Shuttle, your deployment pipeline syncs directly with your codebase. Push updates to your selected branch, and Shuttle automatically rebuilds and redeploys your app. Your project stays in sync with your latest code - no extra clicks required.
Fewer steps, fewer tools, and more time spent actually building.
## How It Works
Connecting GitHub to Shuttle is simple - and it all happens inside the Shuttle console.
1. Head to your [**Integrations**](https://console.shuttle.dev/account/integrations) page
2. Click **"Connect to GitHub"** and authorize Shuttle.
3. Choose the repositories you want to deploy from.
Once connected, your GitHub account appears in the Shuttle dashboard. From there, you can:
- Select a repository and deploy directly from the dashboard.
- Choose which branch to deploy.
- Add environment secrets.
- Enable automatic deployments with one toggle.
Pro tip: Next time you push to that branch, your code is live - automatically.
## Key Features
Here's what makes the GitHub integration more than just a connection:
1. **Automatic Deployments** - Every push triggers a fresh build and deployment. No manual redeploys.
2. **Deploy from Dashboard** - Launch new versions directly from the Shuttle console without touching the CLI.
3. **Pre-Built Templates** - Deploy example apps instantly from our GitHub templates — ideal for getting started fast.
4. **Link Existing Repos** - Bring your own repository and connect it to any Shuttle project, new or existing.
5. **Fully Hosted, Fully Rust** - All the performance and control of Rust, without worrying about infra.
## A Simpler Workflow for Rust Developers
Let's say you're building a Rust API. Normally, you'd have to:
- Push your code to GitHub.
- Open your deployment tool or CI/CD pipeline.
- Configure build steps, secrets, and environments.
- Trigger a redeploy manually.
With Shuttle? You push to GitHub and... that's it.
Your app rebuilds and redeploys automatically — live, hosted, and ready before you've finished your coffee.
It's the clean, modern workflow that lets you focus on your code, not your config files.
---
## Deploy Templates in Seconds
Don't have a repository yet? [Shuttle's **template library**](https://console.shuttle.dev/templates) make it easy to start.
Pick a template from our [Templates page](https://console.shuttle.dev/templates), connect your GitHub account, and Shuttle automatically:
- Creates a new repository in your GitHub account
- Sets up a ready-to-run Shuttle project
- Deploys it instantly to production
It's the fastest way to go from zero to a live Rust app — no CLI installation, no setup pain.
## Managing Your Connection
You can manage all your GitHub connections right inside Shuttle:
- View and change linked repositories per project.
- Disconnect or reconnect at any time.
- Enable or disable automatic deployments with a single switch.
All without affecting your existing deployments or GitHub repos.
## Start Deploying Smarter
The GitHub integration is available to all Shuttle users.
Connect your repo, push your code, and let Shuttle handle the rest — from build to production.
👉 [**Connect your GitHub account and deploy now →**](https://console.shuttle.dev/)
---
# Claude Code Best Practices - Use Claude to Its Full Potential
Source: https://www.shuttle.dev/blog/2025/10/16/claude-code-best-practices
Date: 16 October 2025
Author: dcodes
Tags: claude, claude code, ai, coding, best-practices
Learn how to maintain high-quality context and get consistently accurate results from Claude Code as your projects grow more complex
I've been using Claude Code pretty heavily over the past few months, and I've learned that there's a clear pattern to how it goes wrong. When your codebase is small, everything works beautifully. You describe what you want, Claude builds it, everything clicks. But as your codebase grows larger and more complex, things start falling apart. Responses get less accurate, context gets messy, and you end up spending more time correcting it than you save.
The issue isn't Claude Code itself. It's how we use it.
I've figured out what separates productive sessions from frustrating ones, and it all comes down to context management, throughout the blog, you'll see that most practices revolve around context management but in different shapes and forms. This guide walks through the practices that keep Claude Code useful as your projects grow more complex, guaranteeing you'll get a consistently high-quality output from Claude as your project grows.
## Context is Everything
Context management makes or breaks your Claude Code experience. Every decision you make should optimize for context efficiency.
Garbage in, garbage out has never been more relevant than today. The quality of information in your context window directly determines the quality of Claude's responses. Feed it noise, and you get noisy output. Feed it clean, relevant information, and you get precise, accurate code.
Most people think about context as a capacity problem - they worry about hitting token limits. That's missing the point entirely. The real issue is context quality, not quantity. You could be at 10% of your context window and still get terrible results if that 10% is filled with irrelevant command outputs, stale error logs, and outdated architectural decisions.
Your context window has limited space. Bad information doesn't just waste tokens - it actively degrades responses. When your context fills up with old command outputs, stale error logs, or outdated notes, Claude will have a hard time distinguishing what's important. Your critical architectural patterns get treated the same as your debug output. Everything blends into noise, and responses become less accurate.
This is why being conservative with your context isn't just about saving tokens. It's also about maintaining quality control. Every piece of information you include should be current, accurate, and directly relevant to the task at hand. If something doesn't meet that bar, it's actively hurting your results.
The practices below all serve this goal: keeping your context window filled with high-quality, relevant information and nothing else.
### Clear Context After Every Prompt
This might sound extreme and unnecessary at first, but the thing is, the more you keep your session running, the more noise and junk you're collecting in your LLM's context window. What matters is that you keep your context window clean and full of high-quality relevant information rather than obfuscated command outputs and error logs that can produce tons of noise and make your AI agent go astray and forget about your project rules and guidelines.
It's a good practice to chop down your tasks into smaller chunks and clear the context as soon as Claude finishes the work, clear the context and start a completely new chat. With Claude Code, you can use the `/clear` command - this should become muscle memory that you execute every few minutes.
I have seen developers keep their chats running for hours without ever clearing. This makes Claude forget about all the rules and guidelines of your project and collects a lot of noise and junk in your context window. It also costs you money and burns through your usage limit faster than necessary.
Clear the context after 1-3 messages. It's fine to occasionally send more messages if Claude couldn't finish the task on the first tries, but it's important to be conservative with it.
There's a catch to this approach though: if we keep clearing context, things get repetitive. You have to repeat yourself constantly and tell Claude about specific things you want to do, or keep explaining the proejct guidelines and standards. The CLAUDE.md files and custom commands covered in the next sections helps you solve this problem. They let you maintain consistency without manually repeating prompts every single time.
### Customize CLAUDE.md Files
Claude Code automatically pulls in the CLAUDE.md files in your project directory and subdirectories into context whenever it starts executing a task. Your CLAUDE.md files are your project's knowledge base. You should make sure that they provide high-quality and highly relevant information about your project and keep them updated almost every day.
An easy way to get started with this is running the `/init` command in Claude Code. This will tell Claude Code to search your codebase and let it understand your project and create a CLAUDE.md file for you. However, this is a very basic approach. It's only good to get started. It's extremely important that you get your hands dirty and update the CLAUDE.md file yourself, review it, and remove any wrong or unnecessary information. Keep in mind, the shorter these files are, the better and more focused your AI agent will be.
Customize the top-level CLAUDE.md and the ones in subdirectories. Keep them under 100 lines and make sure they're explaining the project's structure, patterns, and standards. Every piece of information you give Claude needs to be as context-efficient as possible. The subdirectory files matter just as much as the main one.
Focus on project-specific patterns, architectural decisions, and common pitfalls specific to your codebase. Include coding standards, naming conventions, and any non-obvious relationships between components. The goal is to give Claude the context it needs to make intelligent decisions without reading your entire codebase. If you find yourself repeating the same instructions across multiple sessions, that's a sign it belongs in your CLAUDE.md file.
### Custom Slash Commands
Slash commands are a great way to avoid repeating yourself constantly and tell Claude about specific things you want to do. For example, you might find yourself repeating the same instructions across multiple sessions, for example you might want to tell Claude to review your code then search the codebase to ensure it didn't create a new function that already exists in the codebase. Instead of prompting it each time, you can create a slash command that does it for you.
You can add slash commands as markdown files in your `./.claude/commands` directory.
This will save you tons of time in the long run, and you'll be saved from the frustration of having to repeat yourself constantly. You can always tweak these slash commands to make them better and better until you're happy with them.
The combination of slash commands and CLAUDE.md files, if you use them properly and carefully, can make your agentic coding experience exceptionally and significantly better. But we're not done yet. There are more techniques that you can follow to make your agentic coding experience even better.
## Always Plan Before Implementation
One of the most common mistakes I see developers make is jumping straight into implementation without a clear plan. You give Claude a vague description of what you want, it starts writing code immediately, and halfway through you realize the approach is completely wrong. Now you're stuck - do you try to salvage the broken implementation, or start over? Either way, you've wasted time and tokens.
The planning phase is where you catch these issues early. When Claude generates a plan, you can review the approach before any code gets written. If something's off, you can course-correct immediately. This is infinitely cheaper than fixing broken implementations.
Claude Code has a built-in planning mode that you can trigger, but the key is actually reviewing those plans critically. Don't just approve plans on autopilot. Read through them carefully. Does the approach make sense for your codebase? Are there edge cases being missed? Is Claude proposing to create new utilities that already exist in your project?
If a plan is fundamentally wrong, don't try to salvage it by editing within the same session. The planning process itself has already consumed significant context with exploratory file reads, architecture analysis, and multiple iterations. Copy the plan to a markdown file, clear your context with `/clear`, and start fresh. This gives Claude a clean slate to generate a better plan without the noise from the failed attempt.
The separation between planning and execution is crucial for context efficiency. Planning involves broad codebase exploration - searching for existing patterns, reading multiple files, analyzing architecture. This generates a lot of exploratory noise. Execution, on the other hand, should be focused and precise. By separating these phases, you keep your implementation context clean and focused on the specific files and functions that need to change.
## Spec-Driven Development
GitHub recently introduced [Spec Driven Development](https://github.blog/ai-and-ml/generative-ai/spec-driven-development-with-ai-get-started-with-a-new-open-source-toolkit/) as a technique for AI-assisted coding that prevents hallucinations and maintains your repository's standards. The core idea is solid, but this approach can be painfully slow. Creating separate spec, plan, and tasks files, then executing them in different sessions, burns through tokens and arguably is a waste of time.
I've found a better implementation that works exceptionally well: combine everything into a single file.
Claude Code does have a built-in planning mode, but I prefer this approach because it gives me more control over the planning process and keeps everything consolidated in one place that I can reference across different sessions.
Instead of managing multiple documents, create one plan file that contains:
- **Spec**: High-level overview of the finished task from an end-user perspective (1-3 paragraphs)
- **Plan**: Your approach and how you'll achieve the goal (1-3 paragraphs)
- **Tasks**: Checkboxes splitting the feature into smaller, executable tasks (as many as needed)
- **Context**: File paths and descriptions of what they do, relevant to achieving the task. (the more the better)
This single-file approach hits the sweet spot for context efficiency. The key is using **Gemini 2.5 Pro** to gather the context first and make the plan, then having Claude Code jump straight to implementation.
I recommend Gemini 2.5 Pro specifically for this because planning requires understanding complex codebases and making architectural decisions - not every model is smart enough for this task. Smaller models often miss important patterns or suggest approaches that don't align with your existing architecture. Gemini 2.5 Pro consistently generates accurate, well-structured plans that respect your codebase's existing patterns.
Here is a simplified example of a custom command for plan generation:
```text
Search the codebase for the relevant files that might be needed for the given task below and generate a `plan.md` file in the `plans//plan.md` file. The file must include these sections:
- **Spec**: A high-level overview of the finished task, which can be a description of the final result or an end-user perspective (1-3 paragraphs max).
- **Plan**: What's your approach? How are you trying to solve this prompt or achieve this goal? (1-3 paragraphs)
- **Tasks**: A list of checkboxes that split the feature into multiple smaller tasks that can be executed separately (as many as needed).
- **Context**: A list of relevant file paths and descriptions of what they are responsible for and what they do.
```
The workflow is straightforward: run this command in **Gemini 2.5 Pro** to create your plan file, then switch to Claude Code to execute it. Gemini 2.5 Pro handles the token-intensive research and planning, Claude Code handles the implementation.
## Offload Context Gathering to Save Tokens
If you're doing heavy development, you'll likely hit Claude Code's 5-hour or weekly usage limits. Unless you have the $200/month subscription, these limits become a real constraint on how much you can get done. But token limits aren't the only reason to offload context gathering. Even if you never hit your limits, using Sonnet 4.5 for codebase searches and summarization is inefficient. Context gathering is a task where even smaller, faster models excel.
This connects directly back to the context quality principle from earlier. When Claude Code searches your codebase, most of what fills your context window is noise. You get raw outputs from `ls` commands listing directory contents, `grep` results showing dozens of potential matches, `find` commands enumerating file paths, and file reads that may or may not be relevant. Each search operation pollutes your context with low-quality information that drowns out what actually matters.
The better approach: let a smaller, faster model deal with that noise. It can run all the messy searches, sift through the results, and distill everything down to a clean, high-quality document. Then you take that document and execute it in a completely fresh Claude Code session with zero noise.
One of the best ways to extend your coding productivity is running **Gemini CLI** in a separate terminal alongside Claude Code. Use it to handle the context-gathering work-searching the codebase, analyzing relevant files, and creating plan.md files that Claude Code can consume.
You can use Gemini CLI (free tier: 60 requests/min, 1,000 requests/day), or Claude Code with a Haiku-based agent, Cursor if you have a subscription, or any other AI tool. What matters is that you don't waste your Claude Code tokens and don't waste time on the slow responses of Claude Code on tasks that faster models handle better.
When you prompt Claude Code to implement the plan file, it doesn't waste tokens searching through your entire codebase. The previous model has already done that work and included all the necessary context in the plan. Claude Code can jump straight to implementation with fresh context and no accumulated noise from the research phase.
This division of labor keeps your Claude Code sessions focused on what it does best: writing code. The context-gathering work gets offloaded to faster, more efficient models.
### Turn Off Auto-Compact
Auto-compact is a feature that quietly consumes a massive amount of your context window before you even start coding. Open a new Claude Code instance and run `/context` to see your current context usage, and you might be shocked at what you find.
In this example, the autocompact buffer is consuming 45k tokens - that's 22.5% of your context window gone before writing a single line of code. This accumulated context comes from previous chat sessions, sitting there whether you need it or not.
Claude Code added auto-compact as a feature to help remember context from old conversations, while it might work for some projects, what's making me to hesitate to use it is that I don't have full control over what context is being added, there is no way for me to know what is in the context and to edit or remove wrong information from it ultimately leaving us with no guarantee of having high-quality context.
We already have better solutions for maintaining context across sessions: CLAUDE.md files capture your project's patterns and standards, custom commands encode repetitive workflows, and plan files consolidate everything needed for a specific task. These approaches give you explicit control over exactly what context Claude receives. Auto-compact, by contrast, pulls in old context that may no longer be relevant to your current work.
Turn it off. Run `/config`, navigate to the Auto-compact option, and press space to toggle it to `false`.
After turning off auto-compact and running `/context` again, you'll see the immediate impact:
The autocompact buffer is completely gone. Went from 45k tokens of accumulated old context to having 176k tokens of free space (88.1% of your context window). This immediately frees up tens of thousands of tokens for context that actually matters to your current task. Combined with frequent `/clear` usage and well-maintained CLAUDE.md files, you'll have complete control over the context instead of letting old sessions pollute your current work.
## Too Many MCP Servers
MCP servers are powerful, they give your AI agent tools to interact with the world beyond its normal boundaries. The problem is they consume context behind the scenes to explain how to use themselves. Some MCP servers take 4-10k tokens just sitting there, doing nothing and most people don't even know they're there.
Some developers add MCP servers and completely forget about them. They install something once, never use it, and without knowing that their AI output is getting worse. The context window is being eaten up by tools that aren't even relevant to the current task.
With Claude Code, you can toggle MCP servers on and off without completely removing them. Type `@` followed by the MCP server name in Claude Code, and you can quickly disable or enable servers as needed. This gives you fine-grained control over which tools are consuming context at any given moment.
If you don't need an MCP server anymore, just completely remove it. Remove every MCP server you're not actively using. The fewer MCP servers you run, the more context Claude has for actual work.
The better approach is project-scoped MCP servers instead of user-scoped ones. Add MCP servers to specific project configurations rather than your global settings. This way, a database MCP only loads when you're working on projects that actually need database access, not when you're writing documentation or working on frontend code.
## Quick Reference
We've covered a lot of techniques throughout this guide, so here's everything consolidated into one place. These are the practices that will keep your Claude Code sessions productive as your codebase grows. Each one serves the same goal: maintaining high-quality context while minimizing noise.
| Practice | What to Do |
| ----------------------- | --------------------------------------------------------------------------------------------------------------------- |
| Clear Context | Use `/clear` after 1-3 messages to prevent context bloat |
| CLAUDE.md Files | Keep under 100 lines with project-specific patterns and standards |
| Slash Commands | Create reusable commands in `~/.claude/commands` for repetitive tasks |
| Turn Off Auto-Compact | Disable in `/config` to prevent old context from consuming 40k+ tokens |
| MCP Servers | Toggle with `@` or remove unused servers to free up context |
| Planning Mode | Use for complex features, separate planning from execution |
| Spec-Driven Development | Use Gemini 2.5 Pro for planning - combine spec, plan, tasks, and context in one file and use Claude Code to implement |
## Conclusion
AI coding tools work exactly like any other software - output quality directly reflects input quality. What you feed into Claude Code determines what you get back. The difference between developers who get consistent value from AI tools and those who struggle comes down to how deliberately they manage context. Every practice in this guide exists to maintain that quality bar.
These aren't one-time setup tasks. Keep your CLAUDE.md files current as your architecture evolves, refine your slash commands as you identify repetitive patterns, and revisit your planning workflows when they stop serving you. The practices compound over time. Your CLAUDE.md files become more accurate as you encounter edge cases. Your slash commands become more refined as you understand what actually saves time. Your planning process becomes more efficient as you learn which details matter and which don't.
The real test isn't whether Claude Code works well on day one with a small codebase - it will. The test is whether it still delivers accurate, useful results six months later when your project has grown ten times larger. That's where these practices matter. The developers who maintain these habits are the ones still getting value from AI coding tools while others have given up out of frustration.
Try these practices with Shuttle's AI-assisted template:
```bash
shuttle init --from shuttle-hq/shuttle-examples --subfolder axum/ai-assisted
```
## Frequently Asked Questions
Clear context after every 1-3 messages using the `/clear` command. This
prevents context bloat and keeps Claude focused on current tasks rather than
being confused by accumulated noise from previous interactions.
Keep it under 100 lines and focus on project-specific patterns, architectural
decisions, coding standards, naming conventions, and non-obvious relationships
between components. Avoid generic information - only include what Claude needs
to make intelligent decisions about your specific codebase.
Auto-compact can consume 40k+ tokens (over 20% of your context window) with
old context from previous sessions. You have no control over what's included,
and it may contain outdated or irrelevant information. CLAUDE.md files and
plan files give you explicit control over context quality.
Use Gemini 2.5 Pro for planning and context gathering - it handles complex
codebase analysis well and is more token-efficient for research tasks. Use
Claude Code (Sonnet 4.5) for implementation where its coding capabilities
shine.
Each MCP server consumes 4-10k tokens just to explain its capabilities, even
when not being used. Toggle off unused servers with `@servername` or remove
them entirely. Use project-scoped MCP servers instead of global ones so they
only load when relevant.
Built-in planning mode is convenient but gives you less control. Spec-driven
development with a single plan file (containing spec, plan, tasks, and
context) lets you use a separate model for research, maintain the plan across
sessions, and start Claude Code with clean, focused context.
---
# MCP Servers for Rust Developers
Source: https://www.shuttle.dev/blog/2025/10/10/mcp-servers-for-rust-developers
Date: 10 October 2025
Author: shuttle
Tags: mcp, rust, tutorial, video
Learn what MCP servers are and see them in action with GitHub, Context7, and Shuttle integrations
Watch how MCP servers transform AI coding assistants from text generators into practical development tools. In this video, David and Mark (Senior Software Engineer at Shuttle) demonstrate three MCP servers that eliminate the constant context switching developers face:
- **GitHub MCP** - Managing issues and pull requests without leaving your editor
- **Context7 MCP** - Getting up-to-date library documentation on demand
- **Shuttle MCP Server** - Deploying Rust applications with simple commands
You'll see each server in action and learn how to set them up yourself.
## What You'll Learn
The video shows how MCP servers give AI assistants direct access to tools and data sources. Instead of explaining what you need and watching the AI generate code, you can have it perform actual operations - deploying apps, searching documentation, or managing GitHub issues.
### Setting Up the Shuttle MCP Server
In the video, you'll see the Shuttle MCP Server in action. It connects your AI assistant directly to Shuttle's deployment platform, handling everything from project creation to log monitoring.
For Cursor, you can add it by clicking the "Add to Cursor" button below.
Or add this to your `mcp.json`:
```json
{
"mcpServers": {
"Shuttle": {
"command": "shuttle",
"args": ["mcp", "start"]
}
}
}
```
The video walks through the complete setup process and shows real deployment examples.
Learn more: [Shuttle MCP Server](https://www.shuttle.dev/blog/2025/10/08/shuttle-mcp?utm_source=shuttle_blog&utm_medium=video&utm_campaign=mcp_servers)
Full documentation: [MCP Server Documentation](https://docs.shuttle.dev/integrations/mcp-server?utm_source=shuttle_blog&utm_medium=video&utm_campaign=mcp_servers)
### Try It Yourself
Get started with Shuttle and deploy your first Rust app:
```bash
shuttle init --from shuttle-hq/shuttle-examples --subfolder axum/hello-world
```
Then connect the Shuttle MCP Server to your AI assistant and deploy directly from your coding session.
Happy coding!
---
# Shuttle MCP Server
Source: https://www.shuttle.dev/blog/2025/10/08/shuttle-mcp
Date: 8 October 2025
Author: dcodes
Tags: mcp, ai, shuttle, deployment, claude, workflow
How we improved the Shuttle MCP server to make AI agents more reliable, with better error handling and context for seamless deployment workflows
AI agents are changing how we build software, and the Model Context Protocol (MCP) is at the heart of this shift. MCP lets AI agents connect with external tools and APIs - kind of like giving your AI assistant hands to actually do things instead of just talking about them.
We've updated our Shuttle MCP server, and it's a proper workflow upgrade. Here's what's new.
## What Does the Shuttle MCP do?
The Shuttle MCP server gives AI agents direct access to Shuttle's platform and documentation. Your AI agent can now:
- Search through Shuttle documentation to understand how things work, ensuring you have the latest information
- Deploy projects directly to Shuttle
- List all your Shuttle projects
- Get detailed information about specific projects
- View deployment logs in real-time for debugging
Instead of copy-pasting commands and switching between your terminal, documentation, and AI chat, your agent handles the entire workflow.
## The Problem With the Previous Version
The first version of our MCP server worked well for most users. The tools were functional, AI agents could call them, and they'd return the expected data for common workflows.
But we noticed struggles in edge cases. When dealing with unusual deployment configurations or error states, agents would sometimes call the wrong tool or miss required parameters. When something failed in these scenarios, they'd get stuck because error messages didn't provide enough context to self-correct.
We realized the problem wasn't the tools themselves as they were powerful enough - it was how we presented them to the agents. In edge cases, agents didn't have enough guidance to understand when or how to use each tool. We'd built powerful functionality but needed to be documented better for AI agents to understand.
## What's New in This Version
The updated server doesn't add flashy new features - it makes the existing ones actually work the way they should. The Agents now have much higher success rates, and even when things go wrong, they know how to recover and fix issues on their own.
We've enhanced how AI agents understand Shuttle. Each MCP tool includes detailed instructions that help agents understand not just what a tool does, but when and how to use it.
We've also reworked error handling. When something goes wrong now, the error messages are designed for AI agents - they provide enough context and guidance for the agent to understand what happened and how to fix it. Instead of getting stuck, agents can self-correct and try again with a high chance of success.
With this, your AI agent works faster and makes fewer mistakes. It understands deployment workflows and can troubleshoot issues on its own.
## What We Learned About Building MCP Servers
Building MCP tools isn't just about writing the code that exposes functionality. It's about documentation and context - specifically, documentation written for AI models rather than humans.
A powerful tool isn't very efficient if the agent doesn't know when and how to use it. You need to provide condensed, structured context that models can actually parse and understand. Otherwise, you're handing your agent a toolbox without labels on any of the tools leaving the agent to guess what to do with it.
This means thinking differently about how you write tool descriptions, parameter explanations, and error messages. Every piece of text needs to be optimized for model comprehension, not human readability.
If you're building your own MCP server, spend as much time on how you describe your tools as you do on implementing them. The quality of that documentation directly determines whether AI agents can actually use what you've built.
## Real-World Benefits
Here's where this gets practical. You can now tell your AI agent "Deploy my Shuttle App" and it handles everything using the Shuttle MCP server:
1. Creates a project for you if you don't have one already
2. Deploys the project to the cloud
3. Handles edge cases
4. Catches and fixes common deployment issues automatically
The entire workflow - from project creation to a live deployment - happens through your AI agent.
We tested this with Claude Sonnet 4.5 to build a complete Rust API from scratch, you can see the MCP server in action. [See the full walkthrough here](https://www.shuttle.dev/blog/2025/10/01/build-rust-api-sonnet-4-5?utm_source=shuttle_blog&utm_campaign=shuttle_mcp_update_announcement).
## Getting Started
### Prerequisites
First, you'll need the latest Shuttle CLI. If you don't have it installed:
**Linux/macOS:**
```bash
curl -sSfL https://www.shuttle.dev/install | bash
```
**Windows (PowerShell):**
```powershell
iwr https://www.shuttle.dev/install-win | iex
```
If you already have Shuttle installed, upgrade to the latest version:
```bash
shuttle upgrade
```
### Configuring the MCP Server
After installing the CLI, configure the MCP server in your IDE or MCP client.
For Cursor, you can add it by clicking the "Add to Cursor" button below.
Or add this to your `mcp.json`:
```json
{
"mcpServers": {
"Shuttle": {
"command": "shuttle",
"args": ["mcp", "start"]
}
}
}
```
For other IDEs and MCP clients, check the [configuration guide](https://docs.shuttle.dev/integrations/mcp-server?utm_source=shuttle_blog&utm_campaign=shuttle_mcp_update_announcement) to learn more.
### Quick Start
The fastest way to try this is with a Shuttle template.
```bash
shuttle init --from shuttle-hq/shuttle-examples --subfolder axum/hello-world
```
Connect your AI agent with the MCP server, and tell it to deploy. Your app will be live in minutes.
## How to Use the Shuttle MCP Server
Here are some practical prompts to test with your AI agent once you have the MCP server configured:
> **Note**: If the AI agent tries to execute the prompt directly without using the MCP tools first, make sure to prompt it explicitly to use the Shuttle MCP server.
**Deployment and Migration:**
- Deploy my app to Shuttle
- Migrate my Rust app to a Shuttle app
- Set up a Shuttle Database for me
**Debugging and Monitoring:**
- Check my production logs and see if we have any issues
- How many Shuttle projects do I have?
**Questions and Documentation:**
- How to scale my compute size on Shuttle?
- How to set up a Shuttle Database?
## Conclusion
This changes how you code with Shuttle. Your AI agent becomes a proper development partner that understands your entire deployment workflow - it can answer questions about your project configuration, check deployment status, review logs when something breaks, and guide you through scaling decisions. The friction between writing code and shipping it basically disappears.
Try it now and see the difference for yourself. Check out our [getting started guide](https://docs.shuttle.dev/getting-started/quick-start?utm_source=shuttle_blog&utm_campaign=shuttle_mcp_update_announcement) to set everything up.
Or get started with our most popular template:
```bash
shuttle init --from shuttle-hq/shuttle-examples --subfolder axum/hello-world
```
---
# Building a Rust API with Claude Sonnet 4.5
Source: https://www.shuttle.dev/blog/2025/10/01/build-rust-api-sonnet-4-5
Date: 1 October 2025
Author: dcodes
Tags: rust, ai, claude, mcp, axum, api
Putting Anthropic's bold claim to the test by building a Rust API from scratch with Sonnet 4.5
Anthropic just dropped Sonnet 4.5 with a very **BOLD CLAIM**: it's the _"best coding model in the world."_ That's a pretty confident statement in a crowded field of AI coding models.
Sonnet has proven itself to be very powerful and capable of handling complex tasks, but lately the community were claiming that Claude is slowly getting worse and it's not as good as it first was. This is especially after OpenAI released their leading coding model **Codex** model for their open source [Codex CLI](https://github.com/openai/codex).
To bring back their users, Anthropic is finally back with a new model **Sonnet 4.5** and the Claude Code VSCode extension has also been updated, so you can use Sonnet 4.5 directly in VSCode or Cursor for a better experience.
So let's see if Sonnet 4.5 is actually worth the hype and put it to the test, we as Rust developers like coding in Rust so this is what this blog post is about, we'll let Sonnet 4.5 build a Rust API for us that collects from 3 RSS feeds and serves them through an HTTP API.
## Building an RSS Aggregator API with Sonnet 4.5
The goal might seem simple at first, but it's not what we're interested in, building the API is easy, what matters is how well Sonnet 4.5 can handle the task and with how many prompts and iterations we can get the API to work exactly as we want.
Here is what we care about:
- **Up to date code**: Writing up to date code without out of date dependencies
- **Accuracy**: How well Sonnet 4.5 can understand the task and deliver the correct code
- **Speed**: How fast Sonnet 4.5 compared to Sonnet 4
- **MCP Capabilities**: How good is it in calling MCP tools
- **Error Prediction**: How well Sonnet 4.5 can predict and handle errors
Let's give it the first prompt:
> Build a Rust RSS aggregator API that fetches these 3 feeds:
>
>
> Hacker News: https://news.ycombinator.com/rss
>
>
> Rust Blog: https://blog.rust-lang.org/feed.xml
>
> XKCD: https://xkcd.com/rss.xml
>
> Endpoints:
>
>
> GET /feeds - all items as JSON
>
>
>
> GET /feeds/\{source\} - filtered by source
>
>
> Use Axum
This is a very high level prompt, the only technical requirement is to use Axum and the endpoints should be GET /feeds and GET /feeds/\{source\}.
## First Impressions
Sonnet 4.5 got to work immediately, created the project and wrote the code for implementing all requirements.
A few things stood out right away:
**The Good:**
- It nailed the implementation. The code was straightforward, idiomatic Rust with proper async/await patterns
- Noticeably faster than Sonnet 4.0. The responses came back quicker, and it seemed more decisive in its approach
- It understood the task completely and delivered exactly what we asked for
**The Not-So-Good:**
- It used Axum 0.7 instead of the current 0.8, which has been out for almost 10 months.
- The RSS feeds we provided actually have different XML formats, Sonnet was supposed to normalize them into a unified JSON structure, but it didn't.
Looking at the code, the code compiles and runs, the API however isn't returning the feed for the Rust Blog due to lack of normalization.
## Iterating: Normalizing the Feeds
I gave Sonnet a follow-up prompt to normalize the feeds:
> The structure of each feed is different, make sure you fetch them first and then normalize them into a unified JSON structure.
It performed exceptionally well, it first sent a GET request to each of the RSS feeds to fetch the data and understand their structure, then it normalized the data into a unified JSON structure, which is exactly what I wanted it to do.
Testing the `/feeds` endpoint, everything was working as expected.
Two prompts. That's all it took to go from initial implementation to a fully working, normalized RSS aggregator. That's really impressive, and the speed in which it did it is something I can't express enough.
## Keeping Dependencies Fresh
There was still one thing bugging me: the outdated Axum version. Let's give another high level prompt and ask it to update the dependencies:
> Some of the crates you've used are outdated. Make sure they're all up to date and read their documentation to make sure there aren't any breaking changes.
Didn't specify which crates were outdated, let's let Sonnet figure it out itself.
There's something to note here, Axum 0.8 has a breaking change in the route syntax, the old 0.7 way was `/:id` for path parameters, but 0.8 requires `/\{id\}` instead. If Sonnet doesn't catch this breaking change, it will cause the application to panic at runtime.
As you might be aware by now, MCPs aren't very friendly when it comes to keeping the context clean, my first thought was "Too many MCP calls is going to blow up the context window." which is true but the important thing is that the model stays sharp and doesn't lose focus.
It actually loooked up the documentation for Axum 0.8 and updated the route syntax correctly. `cargo build` works, and no runtime errors and both endpoints work perfectly.
Three prompts total with zero compilation errors so far is quite impressive.
## Deploying to Shuttle
With a working API in hand, there was one more test: deployment. Claude Code has MCP (Model Context Protocol) integration with Shuttle, so I wanted to see if Sonnet could handle the entire deployment workflow.
I have the [Shuttle MCP](https://docs.shuttle.dev/integrations/mcp-server) installed in Claude, so it can interact with the Shuttle platform. To install it, you can run:
```bash
claude mcp add Shuttle shuttle mcp start
```
For Cursor, you can add it by clicking the "Add to Cursor" button below.
Or updating your `mcp.json` file to include the following:
```json
{
"mcpServers": {
"Shuttle": {
"command": "shuttle",
"args": ["mcp", "start"]
}
}
}
```
You should also have the [Shuttle CLI installed](https://docs.shuttle.dev/getting-started/installation) and logged in to Shuttle, I recommend running `shuttle upgrade` if you already have it installed, you can do this by running:
```bash
shuttle login
```
I gave it this prompt:
> I want you to use the Shuttle MCP to search the docs on how to convert the app to a Shuttle app and then deploy it to Shuttle.
It identified the required changes and updated the dependencies to include Shuttle runtime.
Then converted the app to a Shuttle app.
With the conversion complete, it proceeded to deploy the API.
There you go, the RSS aggregator was live and accessible. The days have changed, the entire process from prompt to production took three simple instructions and maybe five minutes of actual work.
## Results Summary
Here's how Sonnet 4.5 performed on our key criteria:
| Criteria | Performance | Notes |
| -------------------- | ------------ | ------------------------------------------------------------------------------------------------------------------------- |
| **Up to date code** | ⚠️ Mixed | Initially used Axum 0.7, but quickly updated to 0.8 when prompted and correctly handled breaking changes |
| **Accuracy** | ✅ Excellent | Nailed the implementation on first try, understood complex requirements like feed normalization and no compilation errors |
| **Speed** | ✅ Excellent | Noticeably faster than Sonnet 4.0, responses came back quicker and more decisively |
| **MCP Capabilities** | ✅ Excellent | Seamlessly used MCP tools to fetch RSS feeds, check documentation, and deploy to Shuttle |
| **Error Prediction** | ⚠️ Good | Caught Axum 0.8 breaking changes and updated route syntax correctly, but missed that RSS feeds have different structures |
**Overall Score: 9/10** - Sonnet 4.5 delivered a production-ready API in just 3 prompts with zero compilation errors and successful deployment.
## Conclusion
Sonnet 4.5 delivered on its promise. Three prompts, zero compilation errors, and a fully deployed Rust API. The speed improvements are noticeable, and the MCP integration makes deployment seamless. While it's not perfect (it did use outdated dependencies initially), it quickly corrected course when prompted.
What matters is that you always keep the context clean and write your `CLAUDE.md` files with caution, do not overfill the context window with junk and always keep updating it and iterating on it until you get the results you want.
The "best coding model" could be true. The combination of accuracy, speed, and tool integration makes it a compelling choice for Rust development.
Want to try building something similar? Get started quickly with:
```bash
shuttle init --from shuttle-hq/shuttle-examples --subfolder axum/ai-assisted
```
---
# Pandas vs Polars: Which Data Processor Runs Faster
Source: https://www.shuttle.dev/blog/2025/09/24/pandas-vs-polars
Date: 24 September 2025
Author: jeremiah
Tags: rust, data-pipelines, pandas, polars, performance, etl
If your workflows hit performance walls, the choice between Pandas vs Polars is critical. Learn benchmarks, code, and how Shuttle enables faster ETL pipelines.
When your data science workflows start hitting performance walls, the choice between Python's Pandas and Rust's Polars becomes critical. I recently discovered this firsthand while processing millions of rows of data that pushed my Python scripts to their breaking point.
The problem many data engineering teams face today isn't just about handling large datasets; it's about doing it efficiently without burning through compute resources or waiting hours for ETL processes to complete. Traditional Python approaches with Pandas, while familiar and feature-rich, often become bottlenecks as data volumes grow.
This article will walk you through a comprehensive performance comparison between Pandas and Polars using real-world data processing tasks. You'll see exact code implementations, actual benchmark results, and learn how to deploy high-performance data pipelines using Shuttle. The results will change how you approach data processing in production.
## Benchmark Dataset: NYC Taxi Trip Data for Real-World ETL
For this comparison, I used the [NYC Yellow Taxi dataset from January 2015—12.7 million trip records](https://www.kaggle.com/datasets/elemento/nyc-yellow-taxi-trip-data) stored in CSV files totalling about 2.1 GB. This dataset serves as an excellent proxy for real-world ETL challenges that data science teams encounter daily.
The dataset characteristics make it representative of typical production scenarios:
- **Scale**: 12.7 million rows with 19 columns across multiple data types
- **Data quality issues**: Missing values, invalid coordinates, and outlier detection requirements
- **Mixed operations**: Requires loading data, cleaning, aggregations, and complex filtering
- **Real-world complexity**: Timestamps, geospatial coordinates, and categorical data sources
The ETL pipeline covers five core operations that appear in most data processing workflows:
1. **Load**: Reading CSV data from storage into memory or lazy frames
2. **Clean**: Handling missing data, filtering invalid values, and data type conversions
3. **Aggregate**: Grouping operations across temporal and categorical dimensions
4. **Filter**: Complex multi-condition filtering and sorting operations
5. **Export**: Writing processed results back to storage systems
This represents typical data pipeline tasks in production environments where teams process transaction logs, sensor data, or user behaviour analytics regularly.
## Performance Bottlenecks in Python ETL with Pandas
Before diving into solutions, let's examine the specific performance bottlenecks that make Pandas challenging for large-scale data processing operations. These limitations become apparent when working with datasets that exceed available system memory or require complex data transformations.
### Eager Loading and Memory Bloat
Pandas uses eager evaluation, meaning every operation executes immediately and creates intermediate results in memory. When you load CSV files, Pandas reads the entire dataset into RAM regardless of whether you'll use all columns or rows:
```python
import pandas as pd
import time
# Pandas immediately loads entire file into memory
start = time.time()
df = pd.read_csv("yellow_tripdata_2015-01.csv") # 2.1 GB file
load_time = time.time() - start
print(f"Loaded {len(df):,} rows in {load_time:.2f}s")
print(f"Memory usage: ~4.6 GB peak")
```
This eager approach creates memory pressure as each transformation step generates new DataFrames, leading to memory usage that can exceed 2-3x the original dataset size during processing operations.
### The Global Interpreter Lock Problem
Python's GIL prevents true multi-threaded execution for CPU-intensive operations, meaning Pandas can only utilize one CPU core at a time for most data processing tasks:
```python
# This aggregation uses only one CPU core despite having 8+ cores available
daily_stats = df.groupby(df['tpep_pickup_datetime'].dt.date).agg({
'trip_distance': ['count', 'mean', 'sum'],
'total_amount': ['mean', 'sum', 'std'],
'passenger_count': ['sum', 'mean']
})
```
Modern systems with 8, 16, or more CPU cores remain underutilized, creating a significant performance bottleneck for data-intensive operations.
### Handling Missing Values and Data Types
Pandas processes missing values through multiple passes over the data, with each operation requiring a full scan of all rows and columns:
```python
# Each operation scans the entire dataset separately
df_cleaned = df.dropna(subset=['pickup_longitude', 'pickup_latitude'])
df_filled = df_cleaned.fillna({'passenger_count': 1})
df_typed = df_filled.astype({'passenger_count': 'int32'})
```
These sequential operations become increasingly expensive as datasets grow, particularly when dealing with wide schemas containing many columns with different data types.
## How Polars Uses Rust for Fast, Multi-Threaded Data Processing
Polars takes a fundamentally different approach to data processing by leveraging Rust's performance characteristics and implementing lazy evaluation throughout the system. This architecture enables significant performance improvements for ETL operations on large datasets. To understand why polars works so well, let's look at the key features of polars:
### Lazy Evaluation and Query Planning
Instead of executing operations immediately, Polars builds a query plan that gets optimized before any actual data processing begins:
```rust
use polars::prelude::*;
// Create lazy frame - no data loading yet
let df = LazyFrame::scan_csv("yellow_tripdata_2015-01.csv", ScanArgsCSV::default())?
.filter(col("trip_distance").gt(0))
.select([col("pickup_datetime"), col("trip_distance"), col("total_amount")])
.group_by([col("pickup_datetime").dt().date()])
.agg([col("trip_distance").mean(), col("total_amount").sum()]);
// Only execute when explicitly requested
let result = df.collect()?;
```
This lazy approach allows Polars to analyze the entire pipeline and apply optimizations like predicate pushdown, column pruning, and operation fusion before touching any data.
### Query Optimization Techniques
Polars automatically applies several query optimization techniques that reduce I/O operations and memory usage:
**Predicate Pushdown**: Filters get moved closer to data sources, reducing the amount of data that needs to be loaded:
```rust
// Polars pushes this filter down to the CSV reader level
let filtered_data = LazyFrame::scan_csv("data.csv", ScanArgsCSV::default())?
.filter(col("passenger_count").gt(0)) // Applied during file reading
.select([col("trip_distance"), col("total_amount")]);
```
**Column Pruning**: Only required columns get loaded from storage, reducing memory usage and I/O:
```rust
// Only loads pickup_datetime and trip_distance columns
let df = LazyFrame::scan_csv("data.csv", ScanArgsCSV::default())?
.select([col("pickup_datetime"), col("trip_distance")])
.collect()?;
```
### Multi-Core Processing and Memory Efficiency
Rust's native threading capabilities allow Polars to utilize all available CPU cores automatically. Operations like aggregations, joins, and sorting distribute work across threads without the GIL limitations that constrain Python:
```rust
// Automatically uses all CPU cores for groupby operations
let daily_stats = LazyFrame::scan_csv("data.csv", ScanArgsCSV::default())?
.group_by([col("pickup_datetime").dt().date()])
.agg([
col("trip_distance").count().alias("trip_count"),
col("trip_distance").mean().alias("avg_distance"),
col("total_amount").sum().alias("total_revenue")
])
.collect()?; // Parallel execution across all cores
```
Memory efficiency comes from Rust's ownership system and Polars' streaming capabilities, which process data in chunks rather than loading entire datasets into memory. As the graph belows shows, Polars also maximizes CPU utilization, distributing work across all cores for consistently fast execution.
## Pandas vs Polars ETL Pipeline Examples
Let's examine side-by-side implementations of the same ETL pipeline using both libraries. These examples show identical data processing logic implemented with each tool's best practices.
### Pandas Implementation: Traditional ETL Approach
```python
import pandas as pd
import numpy as np
from datetime import datetime
import time
import json
class PandasETL:
def __init__(self, file_path):
self.file_path = file_path
self.df = None
self.metrics = {}
def load_and_clean_data(self):
"""Load CSV data and perform cleaning operations"""
print("Loading and cleaning data...")
start_time = time.time()
# Load entire CSV into memory
self.df = pd.read_csv(self.file_path)
# Clean invalid coordinates and trip data
self.df = self.df[
(self.df['pickup_longitude'] != 0) &
(self.df['pickup_latitude'] != 0) &
(self.df['trip_distance'] > 0) &
(self.df['trip_distance'] < 100) &
(self.df['passenger_count'] > 0) &
(self.df['passenger_count'] <= 6)
]
# Convert datetime columns
self.df['tpep_pickup_datetime'] = pd.to_datetime(
self.df['tpep_pickup_datetime']
)
self.df['tpep_dropoff_datetime'] = pd.to_datetime(
self.df['tpep_dropoff_datetime']
)
# Calculate trip duration
self.df['trip_duration_minutes'] = (
self.df['tpep_dropoff_datetime'] - self.df['tpep_pickup_datetime']
).dt.total_seconds() / 60
# Remove trips with invalid duration
self.df = self.df[
(self.df['trip_duration_minutes'] > 0) &
(self.df['trip_duration_minutes'] < 480)
]
load_clean_time = time.time() - start_time
self.metrics['load_clean_time'] = load_clean_time
print(f"✅ Loaded and cleaned {len(self.df):,} rows in {load_clean_time:.2f}s")
return self
def aggregate_data(self):
"""Perform aggregation operations"""
print("Performing aggregations...")
start_time = time.time()
# Add date columns for grouping
self.df['date'] = self.df['tpep_pickup_datetime'].dt.date
self.df['hour'] = self.df['tpep_pickup_datetime'].dt.hour
# Daily statistics
daily_stats = self.df.groupby('date').agg({
'trip_distance': ['count', 'mean', 'sum'],
'trip_duration_minutes': 'mean',
'passenger_count': 'sum',
'total_amount': ['mean', 'sum']
})
# Hourly patterns
hourly_stats = self.df.groupby('hour').agg({
'trip_distance': ['count', 'mean'],
'total_amount': 'mean'
})
aggregate_time = time.time() - start_time
self.metrics['aggregate_time'] = aggregate_time
print(f"✅ Aggregations completed in {aggregate_time:.2f}s")
return self
```
### Polars Implementation: Lazy ETL Pipeline
```rust
use polars::prelude::*;
use std::collections::HashMap;
use std::time::Instant;
pub struct PolarsETL {
metrics: HashMap,
}
impl PolarsETL {
pub fn new() -> Self {
Self { metrics: HashMap::new() }
}
pub fn run_etl_pipeline(&mut self, file_path: &str) -> PolarsResult {
println!("🚀 Starting Polars ETL pipeline...");
let total_start = Instant::now();
// Build lazy query plan
let lazy_df = LazyFrame::scan_csv(file_path, ScanArgsCSV::default())?
.select([
col("pickup_longitude"),
col("pickup_latitude"),
col("trip_distance"),
col("passenger_count"),
col("tpep_pickup_datetime"),
col("tpep_dropoff_datetime"),
col("total_amount")
])
// Apply filters (pushed down to scan level)
.filter(
col("pickup_longitude").neq(lit(0.0))
.and(col("pickup_latitude").neq(lit(0.0)))
.and(col("trip_distance").gt(lit(0.0)))
.and(col("trip_distance").lt(lit(100.0)))
.and(col("passenger_count").gt(lit(0)))
.and(col("passenger_count").lt_eq(lit(6)))
)
// Parse datetime columns
.with_columns([
col("tpep_pickup_datetime").str().strptime(
DataType::Datetime(TimeUnit::Microseconds, None),
StrptimeOptions::default(),
lit("coerce")
),
col("tpep_dropoff_datetime").str().strptime(
DataType::Datetime(TimeUnit::Microseconds, None),
StrptimeOptions::default(),
lit("coerce")
)
])
// Calculate trip duration
.with_columns([
(col("tpep_dropoff_datetime") - col("tpep_pickup_datetime"))
.dt().total_minutes()
.alias("trip_duration_minutes")
])
// Filter by trip duration
.filter(
col("trip_duration_minutes").gt(lit(0.0))
.and(col("trip_duration_minutes").lt(lit(480.0)))
);
// Execute aggregations
let daily_stats = lazy_df
.clone()
.with_columns([col("tpep_pickup_datetime").dt().date().alias("date")])
.group_by([col("date")])
.agg([
col("trip_distance").count().alias("trip_count"),
col("trip_distance").mean().alias("avg_trip_distance"),
col("trip_distance").sum().alias("total_trip_distance"),
col("trip_duration_minutes").mean().alias("avg_duration"),
col("passenger_count").sum().alias("total_passengers"),
col("total_amount").mean().alias("avg_fare"),
col("total_amount").sum().alias("total_revenue")
])
.collect()?;
let total_time = total_start.elapsed().as_secs_f64();
self.metrics.insert("total_time".into(), total_time);
println!("✅ ETL pipeline completed in {:.2f}s", total_time);
Ok(daily_stats)
}
}
```
### Environment Setup for Reproducible Results
To run these benchmarks consistently, I used the following setup:
```bash
# Python environment
python3 -m venv pandas_env
source pandas_env/bin/activate
pip install pandas==2.1.0 numpy==1.24.0 psutil
# Rust environment
curl --proto '=https' --tlsv1.2 -sSf https://sh.rustup.rs | sh
cargo --version
rustc --version
# System specifications for reproducibility
# CPU: 8-core Intel i7 (16 threads)
# RAM: 32GB DDR4
# Storage: NVMe SSD
# OS: Ubuntu 22.04 LTS
```
These side-by-side implementations highlight the key design differences between Pandas and Polars. Pandas follows an eager, memory-intensive approach, while Polars builds an optimized lazy query plan that executes more efficiently. With both pipelines producing the same analytical outputs, the real distinction emerges in how they perform at scale.
## Polars vs Pandas Performance on ETL Tasks
After running identical ETL operations on the 12.7 million row NYC taxi dataset, the performance differences are substantial. Here are the detailed benchmark results across all major operations:
### Execution Time Comparison
| ETL Operation | Pandas (seconds) | Polars (seconds) | Speedup Factor | Notes |
| -------------- | ---------------- | ---------------- | -------------- | ----------------------------------------------------- |
| Load + Clean | 43.60 | Deferred | - | Polars defers load/clean until execution phase |
| Aggregations | 9.21 | 13.80 | 0.67x \* | Polars executes load + clean + aggregation together |
| Filter + Sort | 9.42 | 5.25 | 1.8x | Polars benefits from predicate pushdown & parallelism |
| Export Results | 0.14 | 0.05 | 2.8x | Polars writes faster due to streaming |
| Total Pipeline | 62.37s | 19.10s | 3.3x | |
\*Includes deferred load/clean phase in Polars
### Memory Usage Analysis
These results are environment-specific. In practice, Polars often uses 30-60% less memory on large CSV workloads due to column pruning and streaming, though actual savings depend on schema and operations.
#### Pandas Memory Profile
- Peak usage: 4,658 MB during processing operations
- Memory pattern: Immediate spike during CSV loading
- Garbage collection: Frequent pauses for cleanup
- Intermediate objects: Multiple DataFrame copies in memory
#### Polars Memory Profile
- Peak usage: ~2,100 MB during aggregation execution
- Memory pattern: Steady increase only during actual processing
- No garbage collection: Rust's ownership system manages memory
- Streaming operations: Data processed in manageable chunks
### CPU Utilization Patterns
Polars automatically parallelizes across available cores. Pandas relies on single-threaded execution for most operations unless explicitly offloaded (e.g., via Dask, Modin).
#### Pandas CPU Usage
- Single-thread utilization: ~12.5% of 8-core system (1 core)
- GIL limitations: Other threads blocked during computation
- Load balancing: Uneven system resource usage
#### Polars CPU Usage
- Multi-thread utilization: ~85% of 8-core system (all cores)
- Parallel operations: Concurrent processing across cores
- Efficient scheduling: Even load distribution across threads
## Why Polars is Faster
The dramatic performance differences stem from fundamental architectural choices. Understanding these differences helps explain when and why you might choose one approach over the other for your data processing systems.
### Eager vs Lazy Execution Models
**Pandas Eager Execution:**
```python
# Each operation executes immediately
df = pd.read_csv("data.csv") # Load: 32.5s
df_clean = df[df['distance'] > 0] # Filter: 8.2s
df_agg = df_clean.groupby('date').sum() # Aggregate: 9.1s
# Total: 49.8s across separate operations
```
**Polars Lazy Execution:**
```rust
// Build query plan without execution
let df = LazyFrame::scan_csv("data.csv", ScanArgsCSV::default())?
.filter(col("distance").gt(0)) // Added to plan: ~0s
.group_by([col("date")]) // Added to plan: ~0s
.sum() // Added to plan: ~0s
.collect()?; // Execute all: 13.8s
```
The lazy approach allows Polars to optimize the entire pipeline as a single operation, eliminating intermediate steps and reducing data movement.
### Efficient Memory Access Patterns
Polars leverages several memory optimization techniques:
**Columnar Data Layout**: Data stored column-wise enables better cache locality and vectorized operations.
**SIMD Instructions**: Single Instruction, Multiple Data processing accelerates numerical computations.
**Zero-Copy Operations**: Data transformations avoid unnecessary memory allocation when possible.
**Streaming Execution**: Large datasets are processed in chunks that fit in the CPU cache.
### Query Rewriting and Optimization
Polars automatically rewrites queries for better performance:
```rust
// Original query
let result = LazyFrame::scan_csv("data.csv", ScanArgsCSV::default())?
.select([col("*")]) // Select all columns
.filter(col("amount").gt(100)) // Filter expensive trips
.select([col("date"), col("amount")]) // Select subset
.collect()?;
// Polars optimization rewrites this to:
// 1. Scan only date and amount columns (column pruning)
// 2. Apply filter during CSV reading (predicate pushdown)
// 3. Skip unnecessary intermediate selections
```
These optimizations occur automatically, without requiring code changes, making Polars faster while maintaining simplicity. **But performance alone isn't the full story.** Once you've squeezed every ounce of speed from your ETL pipeline, the next challenge emerges: _how do you take that optimized workflow and actually run it in production at scale, reliably, and without DevOps headaches?_
Benchmarking on your laptop is one thing; managing deployments, scaling, SSL certificates, and infrastructure is another. **That's where Shuttle comes in.** With Shuttle, you can deploy your Polars ETL pipeline as a production-ready API in just a few commands, no containers, no load balancers, no endless YAML files.
## Deploying a Rust ETL Pipeline with Shuttle
Of course, benchmarks are only half the story. The real challenge is turning a fast local pipeline into something production-ready. That's where Shuttle helps: it lets you deploy Polars pipelines as APIs without wrestling with infra. Traditional Rust deployment can be complex, but Shuttle abstracts away the infrastructure management.
### Building a Production ETL API
Here's how to wrap our Polars ETL pipeline in a web API suitable for production use:
```rust
use axum::{routing::get, Router, Json};
use serde::{Serialize, Deserialize};
use shuttle_runtime::main;
use tower_http::cors::CorsLayer;
#[derive(Serialize)]
struct ETLResults {
processing_time_seconds: f64,
rows_processed: u64,
daily_statistics: Vec,
performance_summary: String,
}
#[derive(Serialize)]
struct DailyStats {
date: String,
trip_count: u64,
avg_distance: f64,
total_revenue: f64,
}
async fn run_etl_benchmark() -> Json {
let mut etl = PolarsETL::new();
// In production, you'd load from your data warehouse
// For demo purposes, we return representative results
let results = ETLResults {
processing_time_seconds: 19.1,
rows_processed: 12_748_986,
daily_statistics: create_sample_stats(),
performance_summary: "Processed 12.7M taxi records in 19.1 seconds using Polars".to_string(),
};
Json(results)
}
async fn health_check() -> Json {
Json(serde_json::json!({
"status": "healthy",
"service": "Polars ETL Pipeline",
"capabilities": ["high_throughput_processing", "multi_core_execution", "memory_efficient"]
}))
}
#[main]
async fn main() -> shuttle_axum::ShuttleAxum {
let router = Router::new()
.route("/", get(health_check))
.route("/etl/benchmark", get(run_etl_benchmark))
.route("/health", get(health_check))
.layer(CorsLayer::permissive());
Ok(router.into())
}
```
### Simple Shuttle Deployment Process
Deploying this ETL pipeline to production requires minimal configuration:
**1\. Deploy with three commands:**
```bash
# Install Shuttle CLI
cargo install cargo-shuttle
# Login to Shuttle
shuttle login
# Deploy to production
shuttle deploy
```
Shuttle handles all the complex infrastructure concerns:
- Container orchestration and scaling
- Load balancing and networking
- SSL certificate management
- Monitoring and logging systems
- Automatic deployments from Git
### Integration with Data Systems
For production use, you can connect this pipeline to various data sources and destinations:
```rust
// Example: Reading from cloud storage
let df = LazyFrame::scan_csv("s3://data-bucket/taxi-data/*.csv", ScanArgsCSV::default())?;
// Example: Writing to data warehouse
let result = df.collect()?;
result.write_parquet("s3://output-bucket/processed-data.parquet", ParquetWriteOptions::default())?;
// Example: Streaming processing
let streaming_df = LazyFrame::scan_csv("data/*.csv", ScanArgsCSV::default())?
.with_streaming(true) // Process in chunks
.collect()?;
```
## Migrating from Pandas to Polars: A Practical Guide
The decision to migrate from Pandas to Polars shouldn't be all-or-nothing. Here's a practical approach for teams considering the transition while minimizing risk and disruption.
### When to Switch and When to Stick with Pandas
**Consider Polars when**:
- Processing datasets larger than available RAM
- ETL operations take more than a few minutes to complete
- Memory usage becomes a limiting factor in your systems
- CPU cores remain underutilized during data processing
- You need predictable performance characteristics
**Stick with Pandas when**:
- Working with datasets under 1GB consistently
- Heavy use of domain-specific libraries that integrate with Pandas
- Rapid prototyping, where development speed matters more than execution speed
- Team lacks Rust experience, and the timeline is tight
- Complex data science workflows with many specialized functions
### Hybrid Workflows: Wrapping Heavy Steps in Polars
You don't need to rewrite entire systems. Start by identifying performance bottlenecks and replacing them with Polars operations:
```python
import pandas as pd
import polars as pl
def hybrid_etl_pipeline(data_path):
# Use Polars for heavy data loading and cleaning
polars_df = pl.scan_csv(data_path)\
.filter(pl.col("amount") > 0)\
.with_columns([
pl.col("timestamp").str.strptime(pl.Date),
(pl.col("end_time") - pl.col("start_time")).alias("duration")
])\
.collect()
# Convert to Pandas for specialized analysis
pandas_df = polars_df.to_pandas()
# Use existing Pandas-based analysis code
result = perform_statistical_analysis(pandas_df)
# Convert back to Polars for final aggregation
final_result = pl.from_pandas(result)\
.group_by("category")\
.agg([pl.col("value").sum(), pl.col("count").count()])\
.collect()
return final_result
def perform_statistical_analysis(df):
# Existing Pandas code remains unchanged
return df.apply(lambda x: complex_statistical_function(x))
```
### Testing Polars Without Rewriting Your Pipeline
Start with a proof-of-concept approach that validates performance improvements:
```python
# 1. Benchmark existing Pandas operations
import time
def benchmark_pandas_operation():
start = time.time()
df = pd.read_csv("large_dataset.csv")
result = df.groupby("category").agg({
"amount": ["sum", "mean", "count"],
"duration": "mean"
})
pandas_time = time.time() - start
return result, pandas_time
# 2. Implement equivalent Polars version
def benchmark_polars_operation():
start = time.time()
result = pl.scan_csv("large_dataset.csv")\
.group_by("category")\
.agg([
pl.col("amount").sum().alias("amount_sum"),
pl.col("amount").mean().alias("amount_mean"),
pl.col("amount").count().alias("amount_count"),
pl.col("duration").mean().alias("duration_mean")
])\
.collect()
polars_time = time.time() - start
return result, polars_time
# 3. Compare results and performance
pandas_result, pandas_time = benchmark_pandas_operation()
polars_result, polars_time = benchmark_polars_operation()
print(f"Pandas: {pandas_time:.2f}s")
print(f"Polars: {polars_time:.2f}s")
print(f"Speedup: {pandas_time/polars_time:.1f}x")
```
### Gradual Migration Strategy
#### **Phase 1: Identify bottlenecks**
- Profile existing code to find slowest operations
- Measure current memory usage and processing time
- Document data types and transformations used
#### **Phase 2: Proof of concept**
- Implement one critical operation in Polars
- Validate identical results between implementations
- Measure performance improvements
#### **Phase 3: Expand coverage**
- Replace additional heavy operations
- Build team familiarity with Polars syntax
- Update deployment processes to handle Rust code
#### **Phase 4: Full migration**
- Convert remaining operations where beneficial
- Optimize query patterns for maximum performance
- Update monitoring and alerting systems
## Final Takeaways
Our benchmarks showed Polars delivering a **3.3x** speedup over Pandas for this ETL workload, with significantly lower memory usage and full CPU utilization. This performance comes from its modern architecture: **lazy evaluation**, **query optimization**, and native **multi-threading** powered by Rust.
However, performance isn't everything. Pandas remains the pragmatic choice for smaller datasets (\<1 GB), rapid prototyping, and tasks deeply integrated with the broader Python data science ecosystem. In practice, many teams adopt a hybrid strategy: using Polars for heavy data preparation and falling back to Pandas for specialized analysis and ML model integration.
Ultimately, if your current pipelines are hitting performance walls, Polars offers a clear path to faster, more scalable processing. But turning that local speed into a production-ready system presents the next hurdle. This is where Shuttle completes the picture. It abstracts away the complexity of containers and infrastructure, allowing you to deploy a high-performance Polars pipeline as a scalable API in minutes, not days. It turns benchmarks into real-world applications without the DevOps overhead.
Ready to see the difference yourself? Deploy the complete Polars ETL benchmark and run your own comparisons with real data.
```bash
shuttle init --from shuttle-hq/shuttle-examples --subfolder axum/polars-otel-shuttle
```
Then deploy it with:
```bash
shuttle deploy
```
Or you can view the complete benchmark code on [GitHub](https://github.com/AdepojuJeremy/pandas-vs-polars-benchmark).
Cheers! 🎉
---
# How to Monitor Data Pipelines in Rust Using OpenTelemetry and Shuttle
Source: https://www.shuttle.dev/blog/2025/09/23/monitor-data-pipelines-in-rust
Date: 23 September 2025
Author: jeremiah
Tags: rust, data-pipelines, monitoring
Silent data pipeline failures slow teams down. Learn how to monitor data pipelines in Rust using OpenTelemetry and Shuttle to ensure observable ETL workflows.
**TL;DR**: _Data pipelines often fail silently, corrupting data before anyone notices. We show you how to build a high-performance, observable ETL pipeline in Rust using Polars for speed, OpenTelemetry for detailed metrics and traces, and Shuttle for zero-config deployment and telemetry export. This guide provides commented code, deployment steps, and dashboard examples to help you catch failures early, pinpoint bottlenecks, and ensure data quality from start to finish._
ETL and data engineering workflows break silently in production. A CSV file processes millions of records, but somewhere in the pipeline, wrong values slip through data validation, memory usage spikes during aggregation stages, or processing slows to a crawl without clear indicators of where the bottleneck occurs. By the time data engineers notice the issue, corrupted data has already propagated downstream.
Python developers working with Pandas frequently encounter this challenge. Memory blowups happen during large dataset processing, errors cascade across transformation stages with minimal context, and debugging performance issues requires manually adding print statements throughout the code. Traditional application monitoring tools focus on web request metrics such as latency, throughput, and error rates, but data pipelines need visibility into processing stages, memory consumption patterns, and data quality indicators.
Here's the alternative: Rust applications with Polars deliver predictable performance, OpenTelemetry provides standardized observability, and Shuttle eliminates infrastructure complexity. By implementing such a combination, you get clean, fast, observable data pipelines that surface issues before they corrupt your data.
This article explains building a production-ready data pipeline that processes real-world datasets while maintaining complete visibility into every processing stage, memory usage pattern, and performance characteristic.
## Benchmark Pipeline: CSV Processing with Polars
Let me show you a working ETL example that processes [NYC taxi CSV files](https://www.kaggle.com/datasets/elemento/nyc-yellow-taxi-trip-data). This pipeline demonstrates the observability challenges that make data engineering workflows different from typical web applications.
The data pipeline follows these stages: load massive CSV files (1.9GB with 12.7 million records), parse datetime fields and geographic coordinates, filter invalid records and outliers, aggregate trip patterns by time periods, and write results for downstream analysis.
Each stage presents monitoring challenges. Loading CSV files requires tracking memory allocation patterns as data enters the system. Parsing operations can fail silently when date formats don't match expectations. Filtering stages need visibility into how many records get rejected and why. Aggregation operations consume the most memory and require peak usage tracking. Output operations need validation that results match expected patterns.
Polars provides the performance foundation for this pipeline. Its lazy evaluation approach minimizes memory pressure, columnar data processing delivers consistent performance across large datasets, and structured operations make precise measurement possible. Unlike Pandas operations that can consume unpredictable amounts of memory, Polars operations have measurable resource requirements that can be monitored and alerted on.
The NYC taxi dataset contains all the characteristics that make observability critical: high record volume, data quality issues with missing coordinates and invalid timestamps, complex geographic and temporal transformations, and memory-intensive aggregation operations. Processing this dataset demonstrates how proper instrumentation reveals bottlenecks and data quality issues before they impact production systems.
## What to Monitor in Data Pipelines (and Why)
Data pipeline monitoring differs fundamentally from web application observability. Instead of request latency and error rates, you need visibility into processing characteristics that determine pipeline reliability and data quality.
- **Stage-level execution time** reveals processing bottlenecks. While web applications measure individual request duration, data pipelines need timing for load operations, parsing stages, transformation steps, aggregation phases, and output generation. A single slow stage can bottleneck the entire pipeline.
- **Throughput and record counts** provide data volume insights. Monitor records processed per second, total record counts per stage, and record rejection rates during validation. These metrics help identify processing capacity limits and data quality trends.
- **Peak memory consumption per stage** prevents out-of-memory failures. Filtering operations might spike memory usage when loading large intermediate results. Aggregation stages require materializing grouped data. Memory patterns vary dramatically based on dataset characteristics and processing logic.
- **Error paths and panics in Rust code** need special attention. Unlike garbage-collected languages, Rust memory safety prevents many runtime failures, but data pipeline errors often relate to schema mismatches, missing files, or invalid data formats. Capturing error context enables rapid debugging.
These metrics differ from typical web application monitoring because data pipelines process discrete batches rather than continuous streams, consume resources in predictable patterns based on dataset size, and fail differently than request-response applications.
Traditional application observability focuses on user-facing performance and system health. Data pipeline observability focuses on data quality, processing efficiency, and resource utilization patterns that affect downstream systems and analysis accuracy.
## Adding Observability to Rust ETL Pipeline with OpenTelemetry
Instrumenting Rust applications for data pipeline monitoring requires strategic placement of tracing spans and metrics collection. The observability approach needs to capture processing stage performance, memory usage patterns, and data quality indicators without significantly impacting pipeline throughput.
Here's how to structure observability in your Rust data pipeline using OpenTelemetry and tracing:
```rust
use polars::prelude::*;
use std::collections::HashMap;
use std::time::Instant;
use tracing::{info, instrument, span, Level};
// Memory monitoring function for RSS tracking
fn rss_mb() -> f64 {
if let Ok(s) = std::fs::read_to_string("/proc/self/status") {
for line in s.lines() {
if let Some(val) = line.strip_prefix("VmRSS:") {
let kb: f64 = val.split_whitespace().nth(0).unwrap_or("0").parse().unwrap_or(0.0);
return kb / 1024.0;
}
}
}
0.0
}
// Track peak memory across processing stages
fn bump_peak(metrics: &mut HashMap, label: &str) {
let m = rss_mb();
metrics.insert(format!("{}_memory_mb", label), m);
let peak = metrics.get("peak_memory_mb").cloned().unwrap_or(0.0);
if m > peak {
metrics.insert("peak_memory_mb".into(), m);
}
}
pub struct PolarsETL {
df: Option,
metrics: HashMap, // Custom metrics storage for pipeline-specific data
}
impl PolarsETL {
pub fn new() -> Self {
Self { df: None, metrics: HashMap::new() }
}
// Automatic span creation with contextual attributes (file path)
#[instrument(level = "info", skip(self))]
pub fn load_data(&mut self, file_path: &str) -> PolarsResult<&mut Self> {
// Manual span creation for nested tracing hierarchy
let load_span = span!(Level::INFO, "etl_load", file = file_path);
let _enter = load_span.enter();
// Structured logging with contextual information
info!("Loading CSV file: {}", file_path);
let start = Instant::now(); // Performance timing measurement
let lf = LazyCsvReader::new(file_path)
.with_has_header(true)
.with_infer_schema_length(Some(2000))
.finish()?
.select([
col("pickup_longitude"),
col("pickup_latitude"),
col("trip_distance"),
col("passenger_count"),
col("total_amount"),
]);
self.df = Some(lf);
let t = start.elapsed().as_secs_f64(); // Duration calculation
self.metrics.insert("load_time".into(), t); // Custom metric storage
bump_peak(&mut self.metrics, "after_load"); // Memory usage tracking
// Structured logging with key-value metrics for observability platforms
info!(
etl.load.duration = t, // Performance metric
etl.load.memory_mb = self.metrics.get("after_load_memory_mb").unwrap_or(&0.0), // Resource usage
stage = "load", // Pipeline stage identifier
"CSV load completed" // Human-readable message
);
Ok(self)
}
// Automatic instrumentation with span naming and skipping of complex parameters
#[instrument(level = "info", skip(self))]
pub fn clean_data(&mut self) -> PolarsResult<&mut Self> {
// Nested span for detailed tracing hierarchy
let clean_span = span!(Level::INFO, "etl_clean");
let _enter = clean_span.enter();
// Stage-specific logging with contextual information
info!("Starting data cleaning stage");
let start = Instant::now(); // Performance measurement start
if let Some(df) = &self.df {
let cleaned = df
.clone()
.filter(
col("pickup_longitude").neq(lit(0.0))
.and(col("pickup_latitude").neq(lit(0.0)))
.and(col("trip_distance").gt(lit(0.0)))
.and(col("passenger_count").gt(lit(0)))
)
.cache();
self.df = Some(cleaned);
}
let t = start.elapsed().as_secs_f64(); // Performance timing
self.metrics.insert("clean_time".into(), t); // Stage-specific metrics
bump_peak(&mut self.metrics, "after_clean"); // Memory tracking per stage
// Multi-dimensional metrics emission with contextual attributes
info!(
etl.clean.duration = t, // Stage performance
etl.clean.memory_mb = self.metrics.get("after_clean_memory_mb").unwrap_or(&0.0), // Resource consumption
stage = "clean", // Pipeline stage tag
"Data cleaning completed" // Completion status
);
Ok(self)
}
}
```
- **Spans with contextual attributes** provide distributed tracing capability. Each processing stage gets its own span with resource attributes like stage, file, and processing metadata. This enables tracing the whole process across complex pipeline operations.
- **Instrumented functions** using the `#[instrument]` attribute automatically capture function entry/exit, execution time, and error conditions. The tracing framework handles span lifecycle management and context propagation.
- **Metrics emission** follows OpenTelemetry conventions with structured field names like `etl.load.duration` and `etl.clean.memory_mb`. These metrics integrate with observability platforms for dashboard creation and alerting.
Memory monitoring through `rss_mb()` reads actual RSS memory consumption from `/proc/self/status`, providing accurate memory usage data during each processing stage. This approach works reliably in containerized environments and cloud deployments.
⚠️ **Platform-Specific Code**: This memory monitoring function reads from the `/proc` filesystem, which is specific to Linux. For cross-platform compatibility, consider using a crate like `sysinfo` that provides unified system information APIs across Windows, macOS, and Linux.
The image below shows the memory usage monitoring for Polars, demonstrating increased memory consumption during processing.
These images show the system monitoring during ETL pipeline execution, where the first image displays baseline performance with low CPU utilization (1-8%) and stable 5.1GB memory usage, the next image shows increased processing activity with CPU8 reaching 32.4% while memory remains stable, and the last one captures peak ETL operations with significantly higher CPU utilization (CPU8 at 85.9%) and elevated memory consumption at 9.9GB, effectively demonstrating how the Rust pipeline scales resource usage during different processing phases and validating the importance of memory monitoring.
By establishing these observability goals upfront, tracking performance, memory usage, and data quality, you create a foundation for reliable monitoring.
## Exporting Observability Data to BetterStack via Shuttle
Shuttle provides out-of-the-box OpenTelemetry integration that eliminates traditional observability infrastructure complexity. Instead of configuring collectors, managing exporters, or writing YAML configurations, you get automatic telemetry data export to your chosen observability platform.
To enable this integration, include [Shuttle's setup-otel-exporter feature](https://www.shuttle.dev/blog/2025/02/19/using-shuttle-with-betterstack) in your runtime configuration:
```toml
[dependencies]
shuttle-runtime = { version = "0.56", features = ["setup-otel-exporter"] }
shuttle-axum = "0.56"
tracing = "0.1"
tracing-subscriber = { version = "0.3", features = ["json"] }
opentelemetry = { version = "0.30", features = ["trace"] }
```
Then configure observability in your application code:
```rust
use tracing_subscriber::{layer::SubscriberExt, util::SubscriberInitExt, EnvFilter};
pub fn init_tracing(service_name: &str) {
let env_filter = EnvFilter::try_from_default_env()
.unwrap_or_else(|_| EnvFilter::new("info"));
let fmt_layer = tracing_subscriber::fmt::layer()
.json()
.with_current_span(true)
.with_timer(tracing_subscriber::fmt::time::UtcTime::rfc_3339());
tracing_subscriber::registry()
.with(env_filter)
.with(fmt_layer)
.init();
}
```
Shuttle's approach eliminates the infrastructure complexity typically associated with observability. No Docker containers running collectors, no YAML configuration files for exporters, no manual OTLP endpoint management. The platform handles OpenTelemetry protocol export, authentication, and routing automatically.
When you enable BetterStack integration in your Shuttle project settings, telemetry data flows directly from your Rust application to BetterStack's ingestion endpoints. The integration includes automatic retry logic, batching for performance, and error handling that would normally require manual configuration.
This approach works because Shuttle's runtime includes a tracer provider that automatically exports spans and metrics when observability integrations are enabled. Your application code focuses on emitting telemetry data using standard OpenTelemetry patterns, while the platform handles infrastructure concerns.
The images above demonstrate the BetterStack observability platform receiving telemetry data from the Rust ETL pipeline, where the first screen shows basic log streams with application startup events including tracing subscriber initialization and service startup messages, while the second reveals detailed OpenTelemetry span data displaying trace IDs, span IDs, and stage timing information, showcasing how the integration captures both high-level application logs and granular distributed tracing data for comprehensive pipeline monitoring.
## Deploying the Observable Pipeline with Shuttle
Shuttle deployment transforms your observable Rust application into a production service with a single command. The platform's infrastructure-from-code approach means your deployment configuration lives in your application rather than external configuration files. The deployment process is broken down into steps:
**Step 1: Set up your application for Shuttle deployment:**
```rust
mod etl;
mod observability;
use axum::{routing::get, extract::Query, response::Json, Router};
use serde::{Deserialize, Serialize};
use std::collections::HashMap;
use tower_http::{cors::CorsLayer, trace::TraceLayer};
use tracing::info;
#[shuttle_runtime::main]
async fn shuttle_main() -> shuttle_axum::ShuttleAxum {
observability::init_tracing("polars-etl-pipeline");
let app = api_router()
.layer(CorsLayer::permissive())
.layer(TraceLayer::new_for_http());
info!(event = "startup", service = "polars-etl", "Application ready");
Ok(app.into())
}
#[derive(Serialize)]
struct BenchmarkResult {
metrics: HashMap,
message: String,
throughput_summary: String,
}
async fn health() -> &'static str {
info!(
etl.health.check = 1,
endpoint = "/health",
"Health check performed"
);
"OK"
}
async fn benchmark(_query: Query>) -> Json {
let start = std::time::Instant::now();
info!(
etl.benchmark.start = 1,
endpoint = "/benchmark",
"Benchmark endpoint called"
);
// Representative pipeline metrics (avoiding heavy processing on production dyno)
let mut metrics = HashMap::new();
metrics.insert("load_duration_ms".to_string(), 1200.0);
metrics.insert("clean_duration_ms".to_string(), 800.0);
metrics.insert("aggregate_duration_ms".to_string(), 400.0);
metrics.insert("total_duration_ms".to_string(), 2800.0);
metrics.insert("records_processed".to_string(), 12_748_986.0);
// Emit metrics for BetterStack dashboards
info!(
etl.load.duration = 1.2,
etl.clean.duration = 0.8,
etl.aggregate.duration = 0.4,
etl.rows.processed = 12_748_986_i64,
stage = "complete",
"Pipeline benchmark completed"
);
let elapsed = start.elapsed().as_millis() as f64;
info!(
etl.request.duration = elapsed,
endpoint = "/benchmark",
"Request completed"
);
let throughput = 12_748_986.0 / 2.8;
Json(BenchmarkResult {
metrics,
message: "Benchmark completed successfully".to_string(),
throughput_summary: format!("Processed 12.7M records in 2.8s → {:.0} rows/sec", throughput),
})
}
fn api_router() -> Router {
Router::new()
.route("/", get(health))
.route("/health", get(health))
.route("/benchmark", get(benchmark))
}
```
**Step 2: Deploy your observable pipeline:**
```bash
# Deploy to Shuttle platform
shuttle deploy
# Monitor deployment and access logs
shuttle status
shuttle logs --follow
```
**Step 3: Testing endpoints confirms telemetry data flows correctly:**
```bash
# Test health endpoint
curl https://your-app.shuttle.app/health
# Generate benchmark telemetry
curl https://your-app.shuttle.app/benchmark
```
Shuttle automatically streams metrics to BetterStack once you configure the integration in your project settings. The platform handles authentication, retry logic, and batching that would normally require manual OTLP configuration.
The above images demonstrate the complete development-to-production workflow for the observable Rust ETL pipeline. The initial screens show local CLI execution with structured JSON logging, revealing detailed performance metrics including 108-second total runtime and stage-by-stage timing breakdown, while subsequent displays present comprehensive telemetry output with dataset information, processing statistics of 12.7M records processed at 4.5M records/second, and deployment configuration details. The workflow continues with the deployed Shuttle application's API endpoints for health checks and benchmarking, followed by captures of the Shuttle deployment process and dashboard showing the running application with telemetry integration and log streaming capabilities, further showing how the same codebase provides both detailed local benchmarking and production-ready observability through feature flags and deployment automation.
## Building Dashboards for ETL Monitoring in BetterStack
When running ETL pipelines, it's not enough to just know they work; you need visibility into how they perform over time. BetterStack dashboards provide that visibility at a glance by transforming your telemetry data into actionable monitoring dashboards. The platform automatically recognises the metric naming patterns from your Rust application and enables sophisticated visualization and alerting capabilities.
Here are some common ETL-specific metrics and their naming conventions you should follow:
- **etl.load.duration**: measures the time spent loading CSV
- **etl.clean.duration**: tracks the performance of data cleaning stage
- **etl.aggregate.duration**: captures how long aggregation operation takes
- **etl.rows.processed**: shows record throughput and overall volume
- **etl.memory.peak**: reports peak memory consumption per stage
You can configure dashboard for data pipeline monitoring like:
**Memory Usage Over Time Dashboard**:
```json
{
"metric": "etl.memory.peak",
"aggregation": "max",
"group_by": ["stage"],
"visualization": "line_chart",
"time_range": "1h"
}
```
**Stage-by-Stage Duration Analysis**:
```json
{
"metrics": [
"etl.load.duration",
"etl.clean.duration",
"etl.aggregate.duration"
],
"aggregation": "avg",
"visualization": "stacked_area",
"group_by": ["stage"]
}
```
**Processing Throughput Tracking**:
```json
{
"metric": "etl.rows.processed",
"aggregation": "rate",
"time_window": "1m",
"visualization": "gauge"
}
```
These visualizations provide insights into processing performance trends, memory consumption patterns during different pipeline stages, and throughput characteristics that help with capacity planning and performance optimization.
These images show Betterstack monitoring dashboards tracking ETL pipeline performance, where the Telemetry interface displays Clean Time and Aggregate Time charts with regular periodic spikes indicating scheduled batch operations, while a separate CPU usage chart reveals sustained high utilization around 1,200-1,500T during data processing, providing essential visibility into pipeline performance and resource monitoring.
With BetterStack's alerting capabilities, you can enable proactive monitoring by setting alerts for memory usage exceeding thresholds, processing duration degradation, or throughput drops below expected levels with integration into incident management systems for automated escalation.
## Local Development and Testing Setup
So, how can you test and benchmark this pipeline on your own local machine with a real dataset? Running the full ETL process within our deployed web service isn't practical; web endpoints need fast responses, not long-running data processing jobs. Instead, we'll use Rust's feature flags to create a separate CLI for local, in-depth testing. This approach lets you experiment with different datasets, measure actual performance characteristics, and validate your observability setup before deploying to production.
Feature flags enable different build targets for local development versus production deployment. This approach allows for comprehensive local testing with real datasets while maintaining production builds as lightweight and cost-effective as possible.
**Configure feature-based compilation in Cargo.toml:**
```toml
[features]
bench-cli = []
default = []
```
**Local development implementation with full ETL processing:**
```rust
#[cfg(feature = "bench-cli")]
fn main() -> Result<(), Box> {
observability::init_tracing("polars-etl-benchmark-cli");
println!("Starting Polars ETL benchmark with observability");
let data_file = std::env::var("DATA_PATH")
.unwrap_or_else(|_| "data/yellow_tripdata_2015-01.csv".to_string());
if !std::path::Path::new(&data_file).exists() {
eprintln!("CSV file not found: {}", &data_file);
eprintln!("Set DATA_PATH environment variable or place file at default location");
return Ok(());
}
let total_start = std::time::Instant::now();
let mut etl = PolarsETL::new();
match etl
.load_data(&data_file)?
.clean_data()?
.aggregate_data()?
.save_results("results")
{
Ok(_) => {
let total_time = total_start.elapsed().as_secs_f64();
println!("ETL benchmark completed in {:.2} seconds", total_time);
let metrics = etl.get_metrics();
println!("Performance metrics:");
for (key, value) in metrics {
if key.contains("time") {
println!(" {}: {:.2}s", key.replace('_', " "), value);
}
}
}
Err(e) => {
eprintln!("ETL processing error: {}", e);
}
}
Ok(())
}
```
**CLI workflow for benchmarking locally** with comprehensive logs and metrics:
```bash
# Process full dataset with detailed telemetry
RUST_LOG=debug cargo run --release --features bench-cli
# Use custom dataset location
DATA_PATH=/path/to/your/dataset.csv \
RUST_LOG=info cargo run --release --features bench-cli
```
**Dataset loading via CLI** enables testing with different data characteristics. The CLI version processes actual CSV files and provides accurate performance measurements, memory usage patterns, and processing throughput data that inform production capacity planning.
Local testing reveals performance characteristics that aren't visible in production monitoring. Memory allocation patterns during aggregation stages, processing bottlenecks with different dataset sizes, and error handling behaviour with malformed data files.
## Wrapping Up: Fast Pipelines with Precise Monitoring
Rust with Polars delivers consistent performance that traditional Python workflows often lack. While Python pipelines struggle with unpredictable memory spikes, Rust provides predictable resource usage that scales linearly with dataset size. Moreover, compile-time error checking prevents the runtime failures that typically corrupt downstream analysis in dynamically-typed environments.
Building on this foundation, OpenTelemetry adds precise monitoring with minimal performance overhead. This enables comprehensive dashboards and proactive alerts that surface issues before they impact data quality. Meanwhile, Shuttle eliminates the deployment complexity that often delays pipeline rollouts, providing zero-config OTLP export, automatic retry handling, and managed authentication out of the box.
The business impact is substantial: teams ship data products 3x faster without infrastructure bottlenecks, process larger datasets with predictable costs, and maintain higher system reliability that directly improves user experience. Together, these tools create production-ready workflows that deliver fast processing through Rust and Polars, comprehensive visibility via OpenTelemetry, and frictionless deployment through Shuttle. This proactive monitoring approach prevents costly memory failures, enables accurate capacity planning, and catches performance bottlenecks before they affect end users.
**Ready to build observable data pipelines? Get started with the complete example:**
```bash
shuttle init --from shuttle-hq/shuttle-examples --subfolder axum/polars-otel-shuttle
```
Then deploy with:
```bash
shuttle deploy
```
## Troubleshooting Telemetry Issues in Rust Pipelines - FAQ
**Q: My metrics aren't showing up in BetterStack. What's wrong?**
**A:** First, double-check your integration settings in the Shuttle console and verify your source token hasn't expired. Second, confirm your metric names in the code (e.g., `etl.load.duration`) exactly match your dashboard queries—BetterStack requires precise field name matching. Finally, redeploy your application after making integration changes, as the OTLP exporter configuration updates during deployment. Test the flow by running `curl https://your-app.shuttle.app/benchmark` and checking if logs appear in BetterStack's log stream before expecting dashboard data.
**Q: Why are my spans missing or not connecting in distributed traces?**
**A:** Check that your OpenTelemetry dependencies use compatible versions; mismatches between `tracing-opentelemetry` and `opentelemetry` crates can break span context propagation. Ensure your instrumented functions include appropriate resource attributes like `stage` or `file`, as missing context reduces trace value. Also, verify your tracer provider configuration includes your service name and resource attributes needed for filtering and grouping in trace analysis.
**Q: My pipeline works in production but fails during local testing. What should I check?**
**A:** Start by validating CSV file locations and permissions—your application needs read access to data files and write access to results directories. Check that your dataset format is compatible with Polars CSV parsing, as schema mismatches or encoding issues can cause silent failures. Monitor memory consumption during testing since large datasets might exceed available memory during aggregation stages. Finally, debug your environment variable configuration, ensuring `DATA_PATH` points to accessible file locations.
**Q: How can I get better error information when my pipeline fails?**
**A:** Implement structured error logging that includes file paths, record counts, and processing stage information in error messages. This context enables rapid issue resolution by showing exactly where and why failures occur, rather than generic error messages that require extensive debugging to understand.
---
# Introducing Shuttle Cobra
Source: https://www.shuttle.dev/blog/2025/09/18/introducing-shuttle-cobra
Date: 18 September 2025
Author: dcodes
Tags: shuttle, python, aws, deployment, infrastructure
Shuttle Cobra brings Infrastructure-from-Code to Python using type hints and decorators, making it easy to deploy Python applications to your own AWS infrastructure.
We spent years building Shuttle for Rust, we listened to the community and the response was incredible. Developers love it because it solves a fundamental problem: the massive gap between writing code and deploying it.
Shuttle's success comes from Infrastructure-from-Code (IfC). Instead of juggling multiple config languages, you write Rust macros that control your infrastructure directly. This lets developers focus on their application logic without the need for a complicated deployment setup.
Over the years, we took advantage of the simplicity of the same pattern for other resources as well. Database provisioning demonstrates this well - in our current platform, developers can add one annotation and have a database ready regardless of the environment they are in and Shuttle will handle each environment specifically: If it's development, it will create a docker container with a Postgres instance and connect it to your code and if it's production, it will either create a dedicated AWS RDS instance or a shared DB based on the annotation.
Everything connects with full type safety without the need to define separate configuration files. This is what makes Shuttle loved by the community.
After many iterations and fixing many issues, we were finally able to provide a seamless experience providing infrastructure to our users. That got us to thinking: _could we step outside of Rust and bring the same experience to other languages?_
**This project is our shot at bringing this same experience to Python.**
## Shuttle Cobra
Shuttle Cobra is our first step to explore this idea and bring IfC to Python and potentially other languages in the future.
**Shuttle Cobra** is a Python framework that makes it easy to deploy Python code to your own AWS infrastructure using Python **type hints** and **decorators**. Unlike our main Shuttle platform, Cobra deploys directly to your own AWS account - you own the infrastructure and pay the AWS costs.
**Shuttle Cobra** is experimental and a POC (proof of concept) at the moment, our main goal is to gather feedback from the community and monitor adoption.
## How Shuttle Cobra Works
Just like Shuttle for Rust, the main goal for **Shuttle Cobra** is also **Simplicity**, we've made it so simple that you can deploy a Python job to AWS just by adding a few lines of code and if you already have a **Python job**, you can just add the same annotations and you're good to go.
Here is an example of a Python job that reads from an S3 bucket and writes to a database:
```python
from typing import Annotated
import shuttle_runtime
import shuttle_task
from shuttle_common import Bucket, BucketOptions, AllowWrite, RdsPostgres, RdsPostgresOptions
@shuttle_task.cron(schedule="0 * * * ? *")
async def main(
bucket: Annotated[
Bucket,
BucketOptions(
bucket_name="grafana-exporter-1234abcd",
policies=[
AllowWrite(account_id="842910673255", role_name="SessionTrackerService")
]
)
],
db: Annotated[RdsPostgres, RdsPostgresOptions()],
):
# ...
if __name__ == "__main__":
shuttle_runtime.main(main)
```
Then just run `shuttle deploy` and you're done. There is **no vendor lock-in** here, you're still using the same AWS libraries (`boto3`, `aioboto3`) that you'd use without **Shuttle Cobra**. The framework just handles the infrastructure setup and you will write code the same way you'd write without it.
## What Happens Under the Hood
When you use `Annotated[Bucket, BucketOptions(...)]`, you're telling **Shuttle Cobra** "I need an S3 bucket with these settings."
Here's what happens when you deploy:
1. The **Shuttle Cobra** CLI reads your type hints to see what AWS resources you need
2. It generates the CloudFormation templates for you
3. Provisions everything in your AWS account
4. Packages your code into a container and deploys it to ECS
5. Sets up the CRON schedule with EventBridge
Your dependencies get injected at runtime, so your code stays clean.
## Fair Warning
This is experimental. Right now it only handles CRON jobs, but we think the approach could work for web services, Lambda functions and other workloads too.
We built this to see if the IfC idea that works so well in Rust could work in other languages. Turns out it can.
## What's Next?
We'd love to hear what you think about **Shuttle Cobra**. Since this is an experimental approach, your feedback will shape where we take it next.
Try it out and let us know:
- Does the IfC pattern feel natural in Python?
- What other AWS resources would be useful?
- What types of workloads beyond CRON jobs would you want to deploy this way?
## Links
- [GitHub repo](https://github.com/shuttle-hq/shuttle-cobra)
- [Docs](https://docs.cobra.shuttle.dev/?utm_source=shuttle_blog&utm_campaign=shuttle_cobra)
- [Discord](https://discord.gg/shuttle)
---
# A Hands-on Comparison of Best MCP Servers for Rust Developers
Source: https://www.shuttle.dev/blog/2025/09/15/mcp-servers-rust-comparison
Date: 15 September 2025
Author: adetokunbo
Tags: shuttle, mcp, rust, docker, github, deployment, axum
Compare the best MCP servers for Rust development. Learn how to deploy Rust applications directly from your IDE.
Model Context Protocol (MCP) servers boost developer productivity by working with an AI coding assistants like GitHub Copilot, Cursor, and Claude. With MCP having full access to the Rust project, the AI assistants are no longer limited to the currently open file; they can now follow instructions to execute commands, analyze the entire codebase, run tests, and automate workflows, making development faster.
Most developers don't rely on a single MCP; instead, they use multiple servers, depending on their task. Each MCP comes with its own strengths and limitations.
In this article, we'll walk through the best MCP servers for Rust developers. We will also compare the most popular MCP servers to break down what each server does best, and show you how to deploy your Rust applications directly from your IDE.
Here is a quick overview of the comparison between the best MCP Servers
| MCP Server | Rust Integration | AI Compatibility | Security Setup | Deployment Support | Notes |
| ----------------------- | ---------------------------------------------------------------------------------------------------------- | ------------------------------------------------------------------------------------ | ----------------------------------------------------------------------------------------- | --------------------------------------------------------------- | ---------------------------------------------------------------------------------- |
| Context7 MCP | Provides up-to-date, version-specific documentation for all libraries including Rust crates | AI assistant can fetch real-time docs and code examples for accurate code generation | Low risk, read-only access to documentation APIs | None | Essential for preventing hallucinated APIs and outdated code examples |
| Docker MCP | Good for developing containerized Rust applications. | AI assistance can issue Docker commands through MCP | Requires elevated privileges for certain operations, which can pose risks if not isolated | Can build, package, and push Rust apps to a Docker Registry | Suitable for those interested in or running Rust applications in Docker containers |
| GitHub Server MCP | Integrates with Rust code repositories and supports CI/CD workflows (GitHub Actions) | The AI assistant can raise PRs, manage issues, and interact with GitHub workflows | Requires GitHub auth token access with limited or supervised privileges | Works effectively with GitHub Actions workflow | Great for managing repositories and automating workflows |
| File System MCP Servers | Provide direct access to Rust source code | AI assistance has complete visibility of the Rust project | Risky because AI assistant can read and modify project files. Sandbox is recommended | Requires a custom script for deployment | Useful for testing workflows that rely on code modifications |
| Memory MCP Servers | No direct Rust project support | Helpful in maintaining conversational context across tasks | Low risk since it operates only in memory | None | It is used in combination with other MCPs or systems |
| Browsing MCP Servers | No direct Rust integration. This is useful for fetching Rust documentation and creating crates.io packages | AI assistant can read and retrieve information from Rust documentation | None | None | Great for referencing external Rust documentation and libraries |
| Shuttle MCP | Built specifically for Rust. It integrates perfectly into the Rust ecosystem | It works well with AI assistants to manage and deploy Rust applications | It handles secrets and other sensitive details securely on the Shuttle Platform | It can deploy Rust applications directly from a developer's IDE | It is helpful for Rust deployment |
Before we deploy our Rust applications directly from the IDE, let's understand what Model Context Protocol (MCP) is and what makes a good MCP for Rust developers.
### What is the Model Context Protocol (MCP)?
Large Language Models (LLMs) such as GPT, Claude, and Gemini are powerful tools that significantly increase developer productivity. However, they share a fundamental limitation: their knowledge is restricted to the time of their training. For example, an LLM trained in early 2024 will not be aware of new frameworks, events, libraries, or any new information that emerges in 2025 or beyond unless it is updated. MCP was designed to close a critical gap in the AI coding assistant ecosystem. It allows AI assistants to go beyond code generation.
MCP is an open standard that was introduced by Anthropic in November 2024. It enables LLMs to connect to various data sources, tools, and APIs, thereby fetching realtime information or performing tasks that exceed their built-in knowledge.
### What Makes a Good MCP for Rust Developers?
When evaluating an MCP server for Rust development, it is essential to keep a few key criteria in mind:
1. **Rust-Native Workflows:** Does the MCP work smoothly with Cargo and popular frameworks like Axum, Actix-Web, or Rocket? The best servers will integrate effectively with the existing Rust ecosystem.
2. **AI Assistant Compatibility:** Can your AI assistant access the MCP server, either through LLMs or a developer IDE? Developers should consider how the MCP will fit into their current workflow. Ideally, the MCP should support both IDE and LLM integrations.
3. **Security and Access:** Security is a crucial factor when choosing the right MCP. Developers need to be confident that their secrets are kept safe and that the MCP server avoids unnecessary privilege escalation.
4. **Setup Complexity:** A good MCP server should be simple to configure and use. It shouldn't require complex installation steps, whether in an IDE or through an LLM.
5. **Deployment Capability:** Can the MCP server assist with end-to-end deployment, beyond just code generation? The best MCPs should be able to generate code, build, test, package, and even deploy Rust applications directly from an IDE.
With these criteria in mind, let's look at the seven most common MCP servers Rust developers actually use.
## The 7 Most Common MCP Servers for Rust Developers
Here is a list of popular MCP servers that are particularly useful for Rust development.
### 1. Context7 MCP Server
Context7 MCP Server addresses one of the most critical challenges in AI-assisted Rust development: outdated and hallucinated documentation. When working with Rust's rapidly evolving ecosystem, developers often encounter AI assistants that generate code based on year-old training data, leading to deprecated APIs, incorrect function signatures, and non-existent methods.
Context7 solves this by providing real-time access to up-to-date, version-specific documentation directly from the source. For Rust developers, this means accurate code examples for popular crates like Axum, Tokio, Serde, and emerging libraries that weren't in the AI's training data.
The main advantage is eliminating the frustration of debugging AI-generated code that uses outdated APIs. Instead of spending time fixing deprecated methods or non-existent functions, developers can trust that the AI assistant has access to current documentation and working code examples.
### 2. Docker MCP Server
Docker MCP Server is ideal for Rust developers managing complex dependencies or building applications that require isolated environments. By running a Rust project inside a Docker container, the AI assistant can conveniently perform builds, run tests, and refactor code in a secure and reproducible way. Developers can easily reproduce builds and dependencies consistently without affecting the other parts of the codebase.
Developers can also run commands inside the Docker container, such as **cargo build**, with confidence that the results will be identical in both production and non-production environments. This consistency is helpful when resolving dependency-related build problems.
Rust developers can leverage pairing Docker MCP with File system MCP to streamline their day-to-day coding activities and automate a smooth workflow. Docker MCP is best used for integration testing, Continuous Integration workflow, or sandbox experimentation.
### 3. GitHub MCP Server
Rust developers derive the most benefits from using the GitHub MCP server when their code repository is hosted on GitHub. This MCP server automates workflows such as setting up Continuous Integration (CI) pipelines with GitHub Actions and managing releases. Developers can ask their AI assistant to handle tasks such as bumping crate versions, generating and maintaining changelog files, and other routine repository management tasks.
The GitHub MCP Server is tightly coupled to GitHub, which means that its full capabilities are only available within the GitHub ecosystem. Teams hosting their code on GitLab, Bitbucket, or other platforms may not find the GitHub MCP server as useful. The GitHub MCP Server is best used when paired with Docker MCP to provide a complete workflow from development to deployment.
### 4. File System MCP Server
The File System MCP Server provides the AI assistant with direct access to read, write, and modify Rust project files. This allows Rust developers to perform tasks such as refactoring code, automatically fixing errors in the codebase, creating new features, and updating Rust files accordingly.
When using the MCP server, developers should have measures in place to track which files that have been modified by the assistant. Combined with GitHub MCP server, version control can be implemented, making it easier to track the changes introduced by File system MCP. For example, an AI assistant could create a new feature, test it within a Docker container, and then set up a CI workflow using GitHub's MCP; this demonstrates how Docker, GitHub, and File System MCP can all work together.
### 5. Memory MCP
Memory MCP stores project-specific knowledge across sessions, making it easier for an AI assistant to remember naming conventions, coding standards, and recurring compiler errors. For Rust developers working across different teams or modules, this helps to enforce consistency and maintain project wide standards.
The main limitation is that the MCP is bound to a single context, which may restrict productivity in large projects that demand switching between multiple contexts. However, when paired with File System or Docker MCP, it can guide developers or an AI assistant during editing or refactoring, ensuring modifications align with the project standard.
### 6. Browsing MCP
Browsing MCP gives the AI assistant realtime access to external information such as crates documentation, Rust official documentation, or usage examples. This MCP is beneficial when working on a task and needing to look up an example implementation or consult documentation without leaving the development workflow.
The main limitation is that Browsing MCP can not modify the file system directly. When combined with other MCPs, such as File System or Docker MCP, the AI assistant can utilize the information it discovers to apply it to the project by creating code, updating files, or testing changes.
### 7. Shuttle MCP
Shuttle MCP is tailored for deploying Rust applications, such as Axum, Actix, or Rocket. For a development team focused on rapid iteration, this MCP allows developers to deploy the application quickly from code to a live environment. Developers can concentrate on writing code while Shuttle handles server setup, SSL certificate management and deployment.
Shuttle focuses on Rust projects and it integrates smoothly with Rust ecosystem. When combined with Docker and File System MCPs, developers can build and test their Rust projects locally. Then deploy to live environment with Shuttle, providing a smooth and end to end workflow
## The Challenges of Managing Multiple MCPs
Using individual MCPs can help accelerate developer productivity, but managing multiple MCPs simultaneously introduces additional complexity. Here are some of the challenges I have encountered while working with various MCPs.
### Resource Management and Performance
When working with multiple MCP servers, there is always the possibility that they will compete for system resources such as CPU and memory. In large Rust projects, this competition can negatively impact IDE performance. It becomes a significant bottleneck when projects rely heavily on multiple MCP servers.
To ensure you get the most out of these MCPs while still maintaining top performance in your Rust projects, here are a few best practices to follow:
- **Monitor and limit resource usage:** Carefully track CPU and memory usage and limit the number of active MCPs to prevent overload.
- **Allocate CPU and memory per MCP:** Assign specific resources to each MCP server to ensure no single server dominates system resources.
### Security and Authentication Complexity
As a developer, when I want to use an MCP server, each server requires its own authentication and security setup. When multiple MCP servers, such as Docker, GitHub, file system, and browsing MCPs, are running simultaneously, managing all the secrets, API keys, access tokens, and security configurations can become challenging. If one MCP is compromised or becomes vulnerable, it could put the entire MCP setup at risk.
To make multiple MCPs safe for use, you can do the following:
- **Implement strict isolation** between servers to prevent a compromised MCP from affecting others. This can be achieved by:
- Running each MCP on its own container or virtual machine.
- Storing secrets or API Keys in a dedicated, secure vault with a separate namespace, so that if one secret is compromised, it does not affect others.
- **Perform regular secret rotation**, for example, yearly or quarterly, to minimize the risk of leaked credentials.
- **Continuously monitor the environment** for any suspicious activity.
The real challenge arises when developers need to use multiple MCP servers simultaneously, such as Docker and GitHub. Each server has its own authentication, logs, and configuration, which can quickly turn into an overwhelming experience. Without a unifying layer, developers end up spending more time managing connections than actually building.
## How MCP Aggregators and API Gateways Solve These Problems
As a developer, I want a solution that enables me to leverage multiple MCP servers with my AI assistant, unifying different tools and data sources into a single, seamless workflow. Platforms like [**Lunar.dev**](http://Lunar.dev), along with other MCP aggregators such as [**Solo.io**](http://Solo.io) and **MCP Bridge**, help tackle the complexity of managing multiple MCP servers. These platforms act as middleware, allowing you to configure various MCPs through a single interface.
Here is how MCP aggregators help:
- **Unified logging:** Developers can view a stream of logs from multiple MCP servers, which is more helpful in debugging than viewing logs from a single MCP server.
- **Security monitoring and access control:** Aggregators provide fine-grained access control, making it easier to identify which permissions are granted to a specific developer.
- **Performance optimization and caching:** Frequently accessed or requested results can be cached at the aggregator level, reducing latency, improving response times for developers, and ultimately saving time.
Rust developers can increase their productivity by integrating AI-assisted workflows into their ecosystem. These aggregators add tremendous value by simplifying integration, reducing overhead, and maintaining a secure and performant development environment, allowing engineers to focus on building code.
### How Shuttle Solves the Deployment Problem
Rust developers are currently facing a significant challenge with deployment. With the assistance of AI in accelerating the generation of code, deploying Rust projects to live environments often requires extra steps compared to other languages like Python or Node JS, which benefits from a mature Platform as a Service (PaaS) solutions, strong community support and extensive resources. On the other hand, Rust ecosystem is still evolving with fewer tutorials, deployment focused tools and best practices available.
You may have generated clean Axum handlers, written comprehensive tests, and even have users waiting for your feature. Yet the moment you are ready to deploy, you are forced into manual deployment processes.
The current deployment workflows for Rust applications require developers to:
- Set up cloud infrastructure
- Set up monitoring and logging
- Handle SSL certificates and domain configuration
There should be a workflow that allows developer to deploy their Rust project directly from their IDE.
Shuttle MCP enables Rust developers to deploy applications directly from their IDE by integrating with Shuttle CLI, which requires a separate installation. This approach boosts productivity by removing the manual steps involved in traditional deployment. Shuttle packages, compiles, and deploys your application automatically, so that you can stay focused on building.
Unlike other solutions that requires complex scripts or Infrastructure as a Code (IaC) configurations which rely on YAML files or provider specific configuration. Shuttle follows an Infrastructure from Code (IfC) approach, which means that your infrastructure is defined directly in your Rust codebase alongside with the application logic.
You can ask your AI assistant to:
- Deploy your Axum API to the live environment
- Check the logs of the deployed service
## Hands-on Example: Build and Deploy a Snippet Sharing API with Shuttle
In this hands-on section, we'll build a Rust + Axum API that powers a simple code snippet sharing service (similar to Pastebin) and demonstrate how to fetch documentation with Context7 MCP Server, create a pull request with GitHub MCP Server and deploy the Rust code using Shuttle MCP Server, with Cursor AI assistance.
The API will include:
- Endpoints to create and retrieve snippets
- Filtering snippets by programming language
- Clean, shareable URLs with 8-character IDs
### API Endpoints
| Method | Endpoint | Description |
| ------ | ---------------- | ------------------------- |
| GET | /health | Health check endpoint |
| POST | /snippets | Create a new code snippet |
| GET | /snippets | List all snippets |
| GET | /snippets/\{id\} | Get a single snippet |
| DELETE | /snippets/\{id\} | Delete a snippet |
#### Step 1: Setting Up Your Environment: Install Rust and Shuttle CLI
Firstly, ensure you have the following software running:
1. **Rust and Cargo:** For local development and testing.
2. **Shuttle CLI:** For deployment into a live environment. You can install it via Cargo, or use the installation script by following this link: [Shuttle CLI Installation.](https://docs.shuttle.dev/getting-started/installation)
3. **Cursor:** An AI coding assistant. We will use it to interact with MPC Servers (Context7, GitHub and Shuttle) for documentation lookup, creating PRs and deploying the Rust application.
#### Step 2: Log in to Shuttle
Authenticate your Shuttle account:
```bash
shuttle login
```
This connects your CLI to your Shuttle account, enabling authorized deployments.
#### Step 3: Setting Up Our Project
Next, we will create our Rust project. Below is an example of the Cargo.toml configuration. You can also generate the below file `Cargo.toml` by running the shuttle command `shuttle init` . Running the command will initializes a new Shuttle project in your current directory.
```toml
[package]
name = "code-snippet-sharing-app"
version = "0.1.0"
edition = "2021"
[dependencies]
axum = "0.8"
tokio = { version = "1", features = ["macros", "rt-multi-thread"] }
shuttle-axum = "0.57.0"
shuttle-runtime = "0.57.0"
shuttle-shared-db = { version = "0.57.0", features = ["postgres", "sqlx"] }
serde = { version = "1.0", features = ["derive"] }
serde_json = "1.0"
uuid = { version = "1.0", features = ["v4", "serde"] }
chrono = { version = "0.4", features = ["serde"] }
nanoid = "0.4"
sqlx = { version = "0.8", features = [
"runtime-tokio-rustls",
"postgres",
"chrono",
"uuid",
] }
```
#### Step 3: Build the Rust Code Locally
Build the Rust code by running this command below to build the Rust project to confirm that there are no errors:
```bash
cargo build
```
#### Step 4: Run the Rust Code Locally
Run the Rust code by running this command below:
```bash
shuttle run
```
#### Step 5: Deploy your app
Now, let's deploy your application using Shuttle and see how it makes deployment easier by handling all the heavy lifting for you. We will be deploying the application using Shuttle MCP Server.
> The URLs used in the following steps are examples. When you deploy your own application, Shuttle will provide you with a unique URL.
From your cursor IDE. Run the command on the prompt
```bash
#Prompt
Deploy the Rust code
Use the Shuttle MCP server.
```
The AI assistant will deploy the application and a link will be generated. You can access your application with the provided link.
For instance, in this case, the link is `https://code-snippet-share-ow2x.shuttle.app`.
Shuttle will:
- Package your code
- Compile it in the cloud
- Provision infrastructure
- Manage SSL certificate
- Deploy your app to a live environment
#### Step 6: Test Your App Deployed Using Shuttle: Health Endpoint
Let's test the application we deployed with Shuttle to ensure all the endpoints are working correctly.
**Health Endpoint:** `https://code-snippet-share-ow2x.shuttle.app/health`
You can use curl from the command line or a tool like Postman. In this example, we will use Postman.
#### Step 7: Test Your App Deployed Using Shuttle: POST Snippet Endpoint
Send a POST request to `https://code-snippet-share-ow2x.shuttle.app/snippets` with a JSON payload to create a new snippet record.
```json
{
"content": "A Hands-on Comparison of Best MCP Servers for Rust Developers",
"language": "Rust",
"title": "Shuttle MCP",
"description": "Explore Shuttle MCP",
"expires_in_hours": 24,
"is_public": true
}
```
#### Step 8: Test Your App Deployed Using Shuttle: GET All Snippets Endpoint
Send a GET request to `https://code-snippet-share-ow2x.shuttle.app/snippets` to retrieve all snippets.
#### Step 9: Test Your App Deployed Using Shuttle: GET a Single Snippet Endpoint
Send a GET request to `https://code-snippet-share-ow2x.shuttle.app/snippets/qjs0BzAq` to retrieve a specific snippet by its ID.
#### Step 10: Use GitHub MCP Server
We will explore how to use the GitHub MCP Server to create a Pull Request (PR) and manage the Rust project on GitHub.
```bash
# Prompt
Raise a PR with my new changes
Using GitHub MCP Server
```
#### Step 11: Use Context7 MCP Server
We will explore how to use Context7 MCP Server to ask questions about the Rust code and access documentation related to the project. In the example below, we demonstrate how to use Context7 MCP Server to ask a question and reference documentation "_I need to reference a Rust documentation on how i can persistent snippet data instead of using in memory HashMap_".
```bash
# Prompt
I need to reference a Rust documentation on how i can persistent snippet data instead of using in memory HashMap.
Using context7 MCP
```
## Wrapping Up
The MCP ecosystem is opening new possibilities for Rust developers. Whether you are managing repositories with GitHub MCP, restructuring projects through the Filesystem MCP, or streamlining research with the Browser MCP, each option reduces friction in its own way. By combining multiple MCP servers, AI assistants can support the entire application lifecycle, allowing developers to focus on writing Rust instead of wrestling with complex infrastructure tools.
Shuttle simplifies deployment, letting you build features, test ideas, and ship production-ready applications in minutes.
Ready to try this out for yourself? Run the following command to get started immediately:
```bash
shuttle init --from shuttle-hq/shuttle-examples --subfolder axum/code-snippet-sharing-app
```
Other ways to get started:
- [Sign up for Shuttle](https://console.shuttle.dev/) to start building with Shuttle.
- [Clone the repository](https://github.com/shuttle-hq/shuttle-examples/tree/main/axum/code-snippet-sharing-app) used in this article to explore how to build with Shuttle.
- [Learn more about Shuttle](https://docs.shuttle.dev) to get started quickly.
Whichever MCP fits your workflow, **Shuttle** makes deploying Rust applications effortless.
---
# How to Migrate to Shuttle Using Cursor and the Shuttle MCP Server
Source: https://www.shuttle.dev/blog/2025/09/11/migrate-to-shuttle
Date: 11 September 2025
Author: dcodes
Tags: shuttle, cursor, mcp, migration, axum, rust
Learn how to migrate your existing Axum application to Shuttle using Cursor and the Shuttle MCP server for seamless deployment.
We've made migration to Shuttle very easy by leveraging our Shuttle MCP server and Cursor. The Shuttle MCP provides up to date documentation to your AI agents so that they'll be able to understand how to interact with the Shuttle platform having the latest information.
In this short tutorial, we'll walk through migrating an existing Axum todo application to Shuttle and we'll deploy the application to Shuttle, we'll do all of that in just a few minutes.
The final migrated project is available at [todo-app example](https://github.com/shuttle-hq/shuttle-examples/tree/main/axum/todo-app).
So, let's get started.
## Prerequisites
You'll need to have a Shuttle account, so if you don't have one, make sure to [create an account](https://console.shuttle.dev) it takes less than a minute.
After signing up, you'll need to install the Shuttle CLI:
```bash
# Install via the official installer (recommended)
curl -sSfL https://www.shuttle.dev/install | bash
shuttle --version
```
> If you already have shuttle installed, make sure you update it by running `shuttle upgrade`.
## Login to Shuttle
Once the CLI is installed, login to your Shuttle account:
```bash
shuttle login
```
This command will redirect you to the Shuttle console in your browser. Click "Authorize" to login.
## Installing the Shuttle MCP Server in Cursor
Installing the Shuttle MCP Server is quite easy to do, you can add it just by clicking the "Add to Cursor" button below.
If not using Cursor no problem, you can manually update your `mcp.json` file to add it to your MCP client. Example:
```json
{
"mcpServers": {
"Shuttle": {
"command": "shuttle",
"args": ["mcp", "start"]
}
}
}
```
The green status indicates that the MCP server is working and all tools ready for your AI agent to use.
## Migrating Your Project
Now comes the interesting part - with this approach, we're gonna make it very easy to migrate to Shuttle. We've already put together a prompt that will guide your AI agent to migrate your existing Axum project to Shuttle. Along with the MCP server, your AI agent will have every bit of information it needs to help you migrate your project.
````md
Convert this existing Rust web application to run on Shuttle using the platform's features:
## Instructions
**CRITICAL: Search Shuttle MCP docs before each task. Pattern: search docs → do task → search docs → do task**
**Always use the latest version of Shuttle dependencies**
**Do not modify versions of existing non-Shuttle dependencies - only add/update Shuttle-specific dependencies**
1. **Analyze codebase** - Examine `main.rs`, `Cargo.toml`, configs
2. **Update dependencies** - Update Cargo.toml
3. **Convert main function** - Transform to use Shuttle runtime
4. **Database integration** - If PostgreSQL is used, search "postgres" using the MCP, then migrate to Shuttle's managed Postgres
5. **Manage secrets** - If environment variables are used, create Secrets.toml with placeholder keys
6. **Auto migrations** - If database is used, ensure migrations run on startup
7. **Create Shuttle.toml** - Create if app serves static assets:
```toml
[build]
assets = ["static/*", "public/*"]
```
8. **Configure tracing** - Remove existing tracing init (keep macros/spans)
9. **Add secrets macro** - Use `#[shuttle_runtime::Secrets]`
10. **Add DB macro** - Use `#[shuttle_shared_db::Postgres]`
11. **Update .gitignore** - Add:
```gitignore
/target
.shuttle*
Secrets*.toml
```
12. **Test locally** - Test if compiles with `shuttle run`
13. **Create project** - Run `shuttle project create --name ` and `shuttle project link --id `
## Requirements
- Preserve all functionality and API behavior
- Make minimal changes - focus on entry point and infrastructure only
- Use `shuttle_runtime::main`
- If PostgreSQL is used: add `shuttle_shared_db::Postgres` and `sqlx::migrate!()`
- If environment variables are used: add `shuttle_runtime::Secrets`
- Remove tracing init (keep macros)
- Ensure works with `shuttle run` and in production
## Next Steps After Migration
After completing the migration, inform about these remaining manual steps:
1. **Fill in actual secret values** in `Secrets.toml` if created (only placeholders can be created)
2. **Review all changes** made during the migration for production readiness
3. **Deploy to production** - request deployment after secrets are set and changes are reviewed
````
Paste the prompt to your AI agent and let it do the work for you.
As you can see, the AI agent is using the Shuttle MCP server to search the documentation and get the latest information about the Shuttle platform.
## Key Migration Changes
The main transformation involves updating your `main` function from a standard Tokio setup to Shuttle's runtime.
```rust
#[shuttle_runtime::main]
async fn main(
#[shuttle_shared_db::Postgres] pool: sqlx::PgPool,
) -> shuttle_axum::ShuttleAxum {
...
}
```
The `shuttle_runtime::main` make the project work with Shuttle's runtime and the `shuttle_shared_db::Postgres` macro is used to provision a PostgreSQL database in production.
**Shuttle Dependencies:**
Some Shuttle dependencies are added to the `Cargo.toml` file:
```toml
[dependencies]
shuttle-runtime = "0.56.0"
shuttle-shared-db = { version = "0.56.0", features = ["postgres", "sqlx"] }
shuttle-axum = "0.56.0"
```
- `shuttle-runtime` - Shuttle's runtime
- `shuttle-shared-db` - To provision a PostgreSQL database in production and Docker for development, [read more about how Shuttle shared db works](https://docs.shuttle.dev/resources/shuttle-shared-db)
- `shuttle-axum` - Shuttle Axum dependencies, we'll use this to create the API router
**Shuttle.toml:**
```toml
[build]
assets = ["static/*"]
```
A `Shuttle.toml` is required for Shuttle to know about the static assets that need to be uploaded.
## Deploying to Shuttle
Once your project is migrated, the AI agent will attempt to create and deploy a project for you. If it didn't do it for you, you can ask it again to do it.
```text
Deploy the project to Shuttle
```
Cursor will call the `deploy` tool to deploy the project to Shuttle and Shuttle will start building your project.
After building is done, you can see the project URL in your Shuttle console and visit the website.
Opening the project URL in the browser, you can see the website is working.
Perfect! 🎉 We've successfully migrated our Axum todo application to Shuttle and deployed it to production.
## Next Steps
Shuttle has more features and we're always adding more and improving the platform, you can check out the [Shuttle documentation](https://docs.shuttle.dev) for more information.
Clone the todo app example by running the following command and start building your own project:
```bash
shuttle init --from shuttle-hq/shuttle-examples --subfolder axum/todo-app
```
---
# Best AI Coding Tools for Rust Projects: IDEs vs Terminals
Source: https://www.shuttle.dev/blog/2025/09/09/ai-coding-tools-rust
Date: 9 September 2025
Author: demola
Tags: rust, ai, coding-tools, development
We tested seven AI coding tools on the same Rust project. See how each performed on speed, accuracy, and terminal vs IDE workflows.
As Rust developers, we tend to rely on familiar setups like Visual Studio Code (VS Code) or the terminal because they offer the speed and control we need. AI coding tools extend these workflows but approach them in different ways. Some plug directly into IDEs, while others work in the terminal. If you are building Rust projects, the real question is which of these tools are actually useful in practice.
To find out, we tested seven popular AI coding assistants by building the same Rust HTTP server with Axum. We compared how quickly they generated code, the quality of what they produced, and how well they fit into everyday Rust workflows.
Because each tool outputs code differently, we also needed a way to deploy their results without switching stacks or starting from scratch. We will walk you through how we solved that as well.
The table below summarizes the key differences between IDE-based and terminal-based AI coding tools:
| Aspect | IDE-Based Tools | Terminal-Based Tools |
| ----------------- | -------------------------------------------------------- | ----------------------------------------------------- |
| Integration | Deep editor integration with real-time suggestions | Command-line focused with file system awareness |
| Workflow | Seamless coding experience within a familiar environment | Context-switching between the terminal and the editor |
| Context Awareness | Full project context with syntax highlighting | File-based context with smart project understanding |
| Learning Curve | Minimal - extends existing IDE workflow | Moderate - requires learning CLI commands |
| Collaboration | Individual developer focused | Often better for pair programming and code review |
| Customization | Limited to IDE extension capabilities | Highly customizable through configuration files |
## AI Coding Tools: IDEs vs. Terminals
Choosing an AI coding tool is about features, as well as matching the tool to how you think and work. Some developers thrive with constant AI suggestions appearing in their editor. Others find this distracting and prefer tools that allow them to describe a problem and then generate complete solutions. The divide between IDE-integrated and terminal-based tools reflects these different working styles.
### What Are IDE-based AI Coding Tools?
IDE-based AI coding tools integrate directly into graphical Integrated Development Environments (IDEs). They enhance the development experience with intelligent code completion, refactoring, optimization, and debugging. Many also bring real-time suggestions, multi-file editing, project-wide refactoring, and built-in chat panels for natural language queries.
With IDE-based tools, you can expect:
- Graphical Interface: Work inside a visual IDE with inline code suggestions, multiple views, and interactive chat panels for prompts.
- Context-Based Suggestions: Get completions and refactoring ideas based on the IDE's deep understanding of your codebase.
- Deep Integration: Leverage the IDE's ecosystem, including project navigation, file management, and version control, all enhanced by AI.
- Higher Resource Usage: Keep in mind that graphical interfaces and IDE overhead usually demand more system resources.
Some of the most popular IDE-based AI coding tools are:
- Cursor
- Windsurf (formerly Codeium)
- VS Code + GitHub Copilot
- Kiro by AWS
**Cursor:**
Cursor is an AI-first code editor built with AI assistance at its core. It takes the familiar foundation of VS Code and layers in advanced AI capabilities, so you can work faster and smarter without giving up your usual workflow. If you've used VS Code before, you'll instantly recognize the interface and navigation, but you'll also see new tools that make coding feel collaborative.
Key features include:
- Native AI Chat Interface: Talk to AI right inside your editor.
- Multi-File Editing with AI: Edit across multiple files in one request.
- Codebase-Wide Understanding: AI understands your whole project.
- Custom AI Model Selection: Pick the AI engine that fits your needs.
- Real-Time Code Generation: Code gets written as you type.
- Smart Autocomplete: Smarter, context-aware autocomplete.
**Windsurf (formerly Codeium):**
Windsurf, rebranded from Codeium, is an AI-powered IDE forked from VS Code and designed to weave AI assistance throughout the entire code development process. Compared to Cursor, Windsurf leans toward a more polished and minimal aesthetic. You can think of it as Apple-like refinement compared to Microsoft's functionality-first approach.
One of Windsurf's standout features is **Cascade**, which enables true agentic programming. With Cascade, the AI can understand your project across multiple files and take coordinated action without requiring you to micromanage every step.
Key features include:
- Intelligent Code Refactoring: Automatically clean up and restructure code without breaking functionality.
- Architecture-Aware Suggestions: Get recommendations that fit your project's overall design.
- Cross-Language Project Support: Seamlessly work across multiple programming languages.
- Advanced Debugging Assistance: Understand errors and get targeted, multi-file fixes.
- Code Quality Insights: Instant feedback on clarity, maintainability, and best practices.
- Deep Static Analysis Integration: Catch hidden bugs, security risks, and performance issues early.
**VS Code + GitHub Copilot:**
GitHub Copilot is one of the most widely used AI coding assistants. It integrates directly into VS Code as well as other popular IDEs and works in real time to suggest code, generate functions from natural language prompts, and explain existing code. Whether you're writing in JavaScript, Python, Go, or working across multiple languages, Copilot blends seamlessly into your environment while tying neatly into the broader GitHub ecosystem.
Key features include:
- AI-Powered Code Suggestions: Get instant code completions from single lines to full functions.
- Natural Language to Code: Describe it in plain English, and let AI write the code.
- Chat and Inline Assistance (Copilot Chat): Ask coding questions and get inline help without leaving your editor.
- Code Explanation and Documentation: Turn complex code into clear explanations.
- Test and Code Refactoring Support: Auto-generate tests and improve code readability safely.
- Multi-Language and Framework Support: Works across dozens of languages and frameworks.
- Integration with GitHub Ecosystem: Easily connects with repos, PRs, and Actions.
**Kiro by AWS:**
Kiro is an AI-native IDE built by AWS and launched in 2025. It was designed to solve the challenges of "vibe coding" by introducing structured, spec-driven development. With this approach, Kiro generates a requirements document that includes user stories, mermaid diagrams, acceptance criteria, and more about what you want to build. You can review the spec, tweak it, and customize it to your needs before writing a single line of code. This way, you don't have to keep prompting over and over to get what you're looking for.
Key features include:
- Spec-Driven Development: Work from a single spec file that acts as your source of truth. AI agents generate, maintain, and evolve your code directly from it.
- Customizable Agent Behavior: Fine-tune how agents operate using steering configs in .kiro/steering/. Set rules like avoiding blocking calls, enforcing structured logging, or running tests on every commit to keep quality consistent.
- Automation Hooks: Add event-based automations to streamline your workflow. For example, regenerate scaffolding when specs change or trigger end-to-end tests when a pull request is opened.
- Multimodal Chat Interface: Collaborate with AI through text, code, and other formats. Get natural help with debugging, explanations, and brainstorming.
- Agentic Programming: Let AI agents handle multi-step tasks. They can plan projects, update specs, and keep changes synced across your codebase.
- AWS Integration: Connect seamlessly with AWS services for deployment, monitoring, and scaling so your projects move smoothly into production.
The key difference between IDE-based AI coding tools is in their approach. Cursor, Windsurf, and Copilot focus on real-time code suggestions and inline assistance for quick iteration. Kiro, on the other hand, takes a different path with agentic, spec-driven workflows that emphasize production readiness and cut down on ad-hoc "vibe coding" chaos. This makes it more agent-led and customizable, giving teams the guardrails and automations they need instead of just editor-centric features.
### What are Terminal-Based AI Coding Tools?
Terminal-based AI coding tools run entirely in the command-line interface (CLI), letting you work with AI models through simple commands and prompts. If you prefer a lightweight, text-driven workflow and often rely on Git or other version control systems, these tools will feel right at home.
With terminal-based tools, you can expect:
- Command Line Interface: Operates fully in the terminal with commands and prompts, often with little or no GUI.
- Lightweight and Fast: Uses minimal system resources, making it ideal for low-spec machines or headless environments such as servers.
- Direct LLM Access: Connect directly to large language models (LLMs) like Claude, GPT, or Gemini, with support for multiple providers.
- Git Integration: Streamline version control workflows by automatically committing changes to Git.
- Automation-Focused: Excel at automating repetitive tasks, running tests, and executing commands without leaving the terminal.
- Steeper Learning Curve: Requires comfort with command-line workflows and provides less visual feedback compared to IDE-based tools.
Popular terminal-based AI coding tools include:
- Claude Code
- Aider
- Gemini CLI
- OpenAI Codex CLI
**Claude Code:**
Claude Code is an AI coding assistant built to run directly in your terminal, designed for developers who want a hands-on but intelligent coding partner. You can delegate complex tasks to it, and it will plan, execute, and explain its work step by step. Whether you're writing new code, testing, debugging, or exploring a large codebase, Claude Code acts as an agentic AI that can navigate files, run multi-step processes, and integrate with your existing tools through natural conversation.
Key features include:
- Natural Language Task Description: Describe what you want in plain English, and Claude handles it.
- File System Awareness: Understands and edits your project's files in context.
- Multi-Step Task Execution: Plans and completes tasks across multiple files seamlessly.
- Flexible Configuration Management: Set up coding preferences and project rules using dotfile-style configuration with claude.md files. Configure global settings in your home directory, project-specific rules in your project root, or granular settings in subfolders for large projects. This hierarchical approach lets you define coding standards, architectural patterns, and team conventions that Claude will automatically follow.
- Integration with Development Tools: Works smoothly with editors, build tools, tests, and version control.
- Conversational Debugging: Debug interactively with step-by-step guidance.
- Code Explanation and Documentation: Turn complex code into clear explanations and documentation.
**Aider:**
Aider is an open-source AI pair programming assistant built to work hand-in-hand with Git. Unlike other coding tools that simply suggest snippets, Aider operates inside your version control workflow, making it especially powerful for collaborative and production-grade projects. It uses large language models to understand your codebase, propose intelligent changes, and keep everything neatly tracked in commits.
Key features include:
- Git-Aware Editing: Understands your Git context and suggests edits easily.
- Multi-file Coordinated Changes: Update multiple files at once for consistent refactoring.
- Automatic Commit Messages: Generate clear, descriptive commits automatically.
- Support for Multiple AI Models: Choose the AI model that fits your project and workflow.
- Real-Time Collaboration: Get live, pair-programmer-style coding suggestions.
**Gemini CLI:**
**Gemini CLI** is Google's lightweight, open-source AI coding agent that brings Gemini models (like Gemini 2.5 Pro) directly into your terminal. With an ascended context window of 1 million tokens, it can analyze entire codebases at once and handle complex workflows with ease.
Key features include:
- Massive Context Window: Powered by Gemini 2.5 Pro, with support for up to 1 million tokens. This gives the AI a deep understanding of your codebase and enables full project analysis.
- Real-time Web Search and Diagrams: Look up information on the web instantly and generate diagrams on the fly to speed up debugging and feature development.
- Open-Source Flexibility: Fully open-source under Apache 2. You can customize it, extend it, and contribute back to the community.
- Generous Free Tier: Get 60 requests per minute and 1,000 requests per day for free with just a personal Google account.
- Security and Sandboxing: Runs in a secure, sandboxed environment with network restrictions, ensuring safe code execution.
**OpenAI Codex CLI:**
OpenAI Codex CLI is an open-source, lightweight coding agent that brings ChatGPT-level reasoning to your terminal. Powered by OpenAI's o3 and o4-mini models, it emphasizes local execution, privacy, and multimodal input, letting you handle tasks like code generation, file manipulation, and test execution directly from the terminal.
Key features include:
- Multimodal Input: Supports text, screenshots, and diagrams to generate or edit code, making feature implementation faster and more intuitive.
- Local Privacy: Runs entirely on your machine, keeping your source code private unless you choose to share it.
- Flexible Approval Modes: Choose from Suggest, Auto-Edit, and Full Auto modes for different levels of control over code changes and command execution.
- Open-Source and Community-Driven: Encourages community contributions and supports multiple AI providers like Gemini and OpenRouter via the Chat Completion API.
- Sandbox Security: Executes commands in secure, sandboxed environments using Docker on Linux and Apple Seatbelt on macOS to ensure safe operations.
With the details of both IDE-based and terminal-based AI coding tools covered, let's now explore why they behave differently when you put them to work on a Rust project.
### What Makes These Categories Behave Differently in Rust?
Rust's strict type system, borrow checker, and focus on safety make AI coding tools behave differently depending on how they integrate with your workflow.
**IDE-based tools** like Cursor, Windsurf, and GitHub Copilot hook directly into the Rust Language Server Protocol (LSP) through rust-analyzer. This means you get real-time, type inference, inline diagnostics, and borrow checker suggestions. The immediate feedback helps catch ownership issues or lifetime mismatches early, reducing compile cycles and making it easier to write idiomatic Rust code. These tools shine in visual debugging and refactoring, using the IDE's deeper understanding of Rust's semantics to speed up iteration in larger projects.
#### Pros and Cons of IDE-Based AI Tools in Rust Projects
Below are some of the benefits you get when you use IDE-based AI tools in your Rust projects:
- Strong support for multi-file refactoring and debugging, reducing time on ownership issues.
- Visual feedback and multi-view interfaces make navigating complex Rust projects easier.
- Deep integration with rust-analyzer provides context-aware fixes for the borrow checker and type errors.
- Seamless real-time suggestions and autocomplete help maintain flow during Rust's error-prone early stages.
While the visuals make it ideal for building and debugging large-scale projects, they still come with some limitations:
- Reliance on a GUI makes them less ideal for headless or remote Rust environments, such as servers.
- Higher resource consumption, which can slow things down on lower-spec machines during Rust compilations.
In contrast to IDE-based tools, **terminal-based tools** such as Claude Code and Aider lean on command-line interactions and external commands like `cargo check` or `cargo build` for validation. Instead of inline suggestions, they generate suggestions on-demand through prompts, which takes an agentic approach of planning and applying multi-file changes or automations in one go. This makes them powerful for strategic code generation or bulk edits, though you'll likely need more manual builds to catch errors. They're lightweight and well-suited for server-side or low-resource development environments, but can feel less intuitive when dealing with Rust's more intricate ownership and lifetime rules without visual aids.
#### Pros and Cons of Terminal-Based AI Tools in Rust Projects
Below are some of the benefits you get when you use terminal-based AI tools in your Rust projects:
- Direct access to LLMs for in-depth explanations of Rust concepts without IDE overhead.
- Strong reasoning capabilities for planning Rust architectures or algorithms.
- Lightweight and fast, making them great for Rust development on servers or low-power devices.
- Well-suited for automation and Git-integrated workflows, including running builds and tests via commands.
While they are fast and less resource-intensive, they also come with some drawbacks:
- Less immediate feedback, as validation depends on manual runs of cargo tools, which can slow iteration.
- Steeper learning curve, since you'll need comfort with the CLI to handle Rust's verbose error messages.
## Hands-On: Building a Rust API with Each Tool
Now it's time to put these tools to the test by building a task management API in Rust and seeing how each one handles the challenge.
**Project Scope:** Five REST endpoints (`create_task`, `get_task`, `list_tasks`, `update_task`, `delete_task`)
**Architecture:** In-memory store (no database, state held in-memory with a `HashMap`)
**Toolchain:** Rust 2024 edition, without pinned crate versions (`axum`, `tokio`, `serde`, `uuid`)
**Evaluation Method:** Each tool was tested with the same starting prompt. We recorded the generated code, its completeness and accuracy, and its integration into the Rust workflow.
### Building with Cursor
We opened a folder `rust-tasks-cursor`in Cursor, launched the **AI chat panel** (Cmd/Ctrl + L) and entered the baseline prompt:
```
Create a new Rust project for a task management API using Axum
```
Cursor created a new Rust project structure that includes a `Cargo.toml` file with the required dependencies:
```toml
[package]
name = "task_manager_api"
version = "0.1.0"
edition = "2024"
[dependencies]
axum = "0.8.4"
hyper = "1.6.0"
serde = { version = "1.0.219", features = ["derive"] }
serde_json = "1.0.142"
tokio = { version = "1.47.1", features = ["full"] }
tower-http = "0.6.6"
```
It also generated a `main.rs` file with the API entry point.
```rust
use axum::{Json, Router, routing::get, serve};
use serde_json::json;
use std::net::SocketAddr;
use tokio::net::TcpListener;
async fn health_check() -> Json {
Json(json!({ "status": "ok" }))
}
#[tokio::main]
async fn main() {
let app = Router::new().route("/health", get(health_check));
let addr = SocketAddr::from(([127, 0, 0, 1], 3000));
println!("Listening on {}", addr);
let listener = TcpListener::bind(addr).await.unwrap();
serve(listener, app).await.unwrap();
}
```
Next, we refined the prompt in the chat panel to flesh out the endpoints:
```
Implement the complete task API with models, handlers, and main server setup
```
Cursor then updated the `main.rs` file with the API models, handlers, and expose the CRUD endpoints.
**What worked:**
- Multi-file editing kept models, routes, and main in sync.
- Inline fixes suggested after compiler errors.
- Excellent for scaffolding large chunks of code fast.
**What didn't:**
- Sometimes hallucinated crate versions.
- Needed a re-prompt to get the right crates and correct some logic.
**Verdict:** Great for **rapid prototyping and multi-file Rust projects**, especially for developers comfortable with VS Code-style workflows.
### Building with Windsurf
We created a `rust-tasks-windsurf` folder in Windsurf and used the same prompt. Windsurf scaffolded a Rust project but took longer due to its **Cascade** checks. The upside is that it proposed project structure refinements (splitting `handlers.rs` and `routes.rs`) and enforced pinned versions in `Cargo.toml`.
**What worked:**
- Architecture-aware suggestions (modularized better than Cursor).
- Helpful explanations for async/await and error handling.
- Strong static analysis integration caught subtle mistakes.
**What didn't:**
- Generation was slower (20-30s per major step).
- Occasionally over-engineered (extra traits not needed for in-memory scope).
**Verdict:** Great for **planning long-lived Rust projects** where architecture matters.
### Building with VS Code + GitHub Copilot
We created a new folder `rust-tasks-copilot` in VS Code and initialized the project by running the command below:
```bash
cargo init
```
Copilot helped fill in dependencies, models, and handler boilerplate as we typed. It excelled at incremental completions but required additional guidance to assemble the full API.
**What worked:**
- Excellent line-by-line and function-level completions.
- Copilot Chat explained compiler errors clearly.
- Fastest at suggesting snippets.
**What didn't:**
- Weak at cross-file consistency (needed manual edits to sync model types).
- Less effective at scaffolding entire APIs in one shot.
**Verdict:** Great for **incremental coding and filling gaps** rather than full project generation.
### Building with Claude Code
In Claude, we entered the same prompt in the terminal. Claude generated a project scaffold, listed the steps it would take, then produced `Cargo.toml` and `main.rs`. It explained async concepts and ownership trade-offs in detail while building.
**What worked:**
- Clear step-by-step reasoning.
- Accurate async handling with axum.
- Strong at explaining lifetimes and error messages.
**What didn't:**
- Slower to reach a runnable version (lots of intermediate narration).
- Sometimes verbose in generated comments, cluttering code.
**Verdict:** Great for **learning Rust while building** (doubles as tutor + generator) **and building large-scale projects**.
### Building with Aider
For this, we initialized Git and prompted Aider. It scaffolded a Cargo project, generated dependencies, and committed each step with descriptive messages. Its Git-aware workflow was unique: each file edit was atomic, with matching commit messages.
**What worked:**
- Excellent Git integration (perfect history for each change).
- Multi-file updates stayed consistent.
- Easy rollback when things went wrong.
**What didn't:**
- Required more prompt iteration than Cursor/Windsurf.
- Less context than IDE-native tools (sometimes needed manual cargo fixes).
**Verdict:** Great for **collaborative, Git-driven workflows** in Rust.
### Building with Gemini CLI
In Gemini CLI, we entered the same prompt in the terminal. Gemini CLI walked us through the steps it would take, then scaffolded a Rust project with a Cargo.toml and main.rs. It also highlighted the project dependencies needed to run the project and installed them.
**What worked:**
- Clear, step-by-step reasoning using the ReAct (reason + act) pattern.
- Accurate async handling with `axum`.
- Solid project structure with a clean separation of concerns.
**What didn't:**
- Took longer to get to a runnable version because the ReAct mechanism tended to overthink the flow.
- Sometimes over-engineered things by introducing extra traits and impl blocks.
**Verdict:** Great for **learning Rust** and refactoring **large-scale projects**.
### Building with OpenAI Codex CLI
With Codex CLI, we gave it the same prompt. This time, it laid out the steps with a visual progress bar, updating as it went. It scaffolded the project, and even showed a change history for each file it touched.
**What worked:**
- Visual, step-by-step reasoning with clear highlights of changes.
- Accurate async handling with `axum`.
- Clear guidance on next steps for improving the application.
**What didn't:**
- No separation of concerns. Everything got bundled into `main.rs` (handlers, models, logic, the works).
- Sometimes over-engineered with unnecessary packages, like extra tracing libs.
**Verdict:** Great for **learning Rust** and **mapping out roadmaps for Rust projects**.
If you're weighing up any of the AI coding tools against each other, here's a quick reference to help decide which fits best in different contexts:
| Tool | Category | Code Quality | Best For |
| ----------- | -------- | ------------ | ----------------------------------------------------- |
| Cursor | IDE | 9 | Fast prototyping, full-feature builds |
| Windsurf | IDE | 8.5 | Architecture planning, complex logic |
| Copilot | IDE | 8 | Incremental completions, patterns |
| Claude Code | Terminal | 9 | Learning and explaining Rust and large-scale projects |
| Aider | Terminal | 8.5 | Git-aware, team-oriented dev |
| Gemini | Terminal | 8 | Complex refactoring and project architecture |
| Codex | Terminal | 8.5 | Fast prototyping, mapping out roadmaps |
Using AI to generate Rust code can be powerful, but even the best tools have their blind spots. IDEs may overlook context rules, terminal tools can feel slower, and both risk introducing subtle bugs if not monitored. The gap between a quick prototype and a maintainable project often comes down to workflow design, rule enforcement, and consistent testing. In the next section, we'll cover best practices for getting the most out of AI coding tools so your Rust projects stay reliable, predictable, and scalable.
## Best Practices for Getting the Most from AI Coding Tools
AI coding tools can feel like magic, but to get **reliable Rust projects**, you need **guardrails**. Start by treating your project like a **product**. Define the kinds of documents a PM would normally create: **project rules, coding standards, API conventions**, and so on. A practical approach is to create `claude.md` files (or equivalent) for each directory, describing the rules explicitly, and load them into the AI's context. This makes it much easier for any AI tool to generate code within your intended scope, especially in larger projects.
Next, build **testing discipline** into your workflow. AI is excellent at TDD, but it will not enforce policy on its own. For example:
- Run unit tests after every code step.
- Run end-to-end tests after major milestones.
- Avoid mocks and stubs unless absolutely necessary.
These practices help reduce **subtle errors** that AI tools can introduce. Keep in mind that IDE-based tools such as **Cursor, Copilot, and Windsurf** sometimes ignore context-loaded rule files. CLI-based tools combined with dotfiles tend to respect them more consistently. That is why CLI workflows can be especially valuable for large or complex Rust projects.
**Security and permissions** are another important consideration. CLI tools usually give you fine-grained control. You can grant permissions per command, or opt in to full access with flags like `--dangerously-skip-permissions` in Claude CLI. IDEs, by contrast, often require broader access and provide fewer safeguards.
**Cost** is also a factor. CLI tools typically consume **tokens** directly from your AI subscription, which can add up quickly on big projects. IDEs such as **Cursor or Windsurf** let you switch between models, but the most capable ones often sit behind pay-as-you-go tiers that can exceed $1,000 for heavy usage. Anthropic Max, for example, offers a predictable monthly price with a token reset system. This makes budgeting easier for long-term Rust projects.
In short, enforce guardrails, define clear rules, and think like a PM. With that mindset, both IDE and CLI AI environments will work more predictably, generate higher-quality Rust code, and integrate smoothly into your deployment pipeline.
## How We Deployed the Rust Applications
Each tool got us to a working Rust API, but in different ways. Some needed a bit of re-prompting, while others were more direct. Instead of setting up separate Dockerfiles, CI pipelines, or custom cloud configs for each tool, we kept things simple with a single deployment workflow powered by Shuttle's [Model Context Protocol](https://docs.shuttle.dev/integrations/mcp-server) (MCP). Here's how you can do the same:
1. Set up Shuttle
- Create a [free Shuttle account](https://console.shuttle.dev/signup).
- Install the [Shuttle CLI](https://docs.shuttle.dev/getting-started/installation), which lets you deploy straight from your machine.
- Configure the CLI by running:
```bash
Shuttle login
```
This will open a browser where you can log in with your credentials.
2. Connect your AI Coding Tool to Shuttle MCP
Add the Shuttle MCP server to your tool of choice. For example, in Windsurf:
- Go to Settings → Windsurf Settings → Manage MCPs → View raw config.
- Paste the server configuration below into the config file:
```json
{
"mcpServers": {
"Shuttle": {
"command": "shuttle",
"args": ["mcp", "start"]
}
}
}
```
Check [Shuttle's documentation](https://docs.shuttle.dev/integrations/mcp-server) for the full list of MCP configurations.
3. Prompt the Tool to Deploy
Now, ask your AI coding tool to deploy the API through the Shuttle MCP server. For example:
```
Deploy the API to Shuttle.
Use the Shuttle MCP server.
```
> _As a rule of thumb, always include the phrase _`Use the Shuttle MCP server.`_ when deploying through the Shuttle MCP server so it can reference the documentation during deployment._
4. Let the Tool Update your Project
When you run the prompt, the tool will update your project for deployment on Shuttle. This includes updating `Cargo.toml` to add the required dependencies:
```toml
shuttle-axum = "0.56.0"
shuttle-runtime = "0.56.0"
```
It will also update the `main` function to use the Shuttle runtime:
```rust
#[shuttle_runtime::main]
async fn main() -> shuttle_axum::ShuttleAxum {
let app_state = AppState::new();
let app = Router::new()
.route("/tasks", get(get_tasks).post(create_task))
.route("/tasks/{id}", get(get_task).put(update_task).delete(delete_task))
.route("/health", get(health_check))
.layer(CorsLayer::permissive())
.with_state(app_state);
Ok(app.into())
}
```
5. View your Deployment
Finally, open your [Shuttle console](https://console.shuttle.dev/) to grab your API URL and other deployment artifacts.
### Beyond Deployment with Shuttle
Shuttle goes further than just deployment. It provides tools and resources that make day-to-day development smoother and more productive:
- **Ready-to-deploy resources** like databases and built-in secrets for managing environment variables.
- **Low-effort prototyping and framework support**, so you can spin up projects quickly with Axum, Actix, Rocket, and more.
- **Community-driven development and support**, with an active open-source community, Discord, and programs to support your workflow.
- **Fast redeploys and local iteration**, making it easy to test changes without waiting on long build times.
- **Infrastructure as Code (IaC)** powered by Rust macros, which means your infrastructure lives directly inside your Rust code instead of separate config files.
## Wrapping Up
The AI coding landscape for Rust is more powerful and flexible than ever. Whether you prefer the visual depth of IDE-based tools or the speed and focus of terminal applications, there's a tool that matches your style.
One thing that never changes is the importance of Rust's core principles. The best AI tool for coding is the one that helps you write idiomatic, safe, and performant Rust while fitting naturally into your workflow.
Whatever tool you choose, Shuttle makes building and deploying your applications effortless. Ready to see it in action? Run this command to get started with a simple Axum web server:
```bash
shuttle init --from shuttle-hq/shuttle-examples --subfolder axum/hello-world
```
---
# The New Shuttle Console Built for Discovery, Speed, and Scale
Source: https://www.shuttle.dev/blog/2025/09/01/new-console
Date: 1 September 2025
Author: archie
Tags: shuttle, console, ui, deployment
Shuttle's redesigned console with better feature discovery, streamlined workflows, and production-ready design for managing projects at any scale.
## Introduction - The New Shuttle Console
We've just shipped a brand new Shuttle Console. As our user base grew and platform matured we knew it was time for a _major_ upgrade. The goal was clear: make it easier to discover features, smoother to manage projects of any size, and reflective of Shuttle's production-ready quality. This update is about simplicity, ease, and scale.
## Why the Console Matters
At Shuttle, our philosophy has always been simple: deploying applications should be straightforward. Infrastructure requirements and code don't need to be separate; your application should be defined, deployed, and scaled without unnecessary complexity.
But while your infra requirements live in code, the console is where you see what's running. It's where you check deployments, understand resources, and discover what else Shuttle can do for you. The console is a window into Shuttle's capabilities.
The new console is our biggest step yet in making that window clearer, faster, and more representative of what Shuttle is: the simplest place to deploy production applications.
## Why We Changed It - Listening and Learning
The old console worked, but it wasn't keeping up with the platform. Features like resources, configurable instance sizes, or collaboration were often hidden away. Workflows weren't always consistent. And for some of our Growth users managing many projects on Shuttle, the console just didn't scale.
You told us what you needed:
- Better feature discoverability.
- More consistent design and workflows.
- A console that matched Shuttle's reliability under the hood.
This redesign is our response.
## What We Changed - Feature Highlights
Here's what you'll notice right away:
- **Project Overview Page**: All essential features in one place. Quick actions, including stop and deploy, and a clean structure make it easy to find and use the features you need.
- **Deployments Page**: Git commit ID and message. as well as full-screen logs
- **Domain Setup**: Clear flow with copy-paste CNAME instructions and validation states.
- **Secret Management**: Manage secrets directly from the console.
- **Configurable Compute Size**: Copy pre-filled compute tier configuration directly into your project for easy instance size adjustments.
- **Design Language**: A standardised, consistent design system across all pages, making every workflow feel predictable and smooth.
## Key Product Decisions - Staying True to Developers
One of the biggest questions we asked ourselves was: _what should the console do, and what should stay in code?_
We kept our opinionated approach: the console shows you what's running and guides you toward the right workflows. That's why you'll see things like pre-filled config snippets instead of dropdown menus. The goal isn't to replace code, but to help you discover and apply Shuttle's features in the right way.
By making these conscious choices, the console becomes more than a dashboard; it's a guide to using Shuttle the way it's meant to be used.
## What This Means for You
- **Faster**: Features are easier to discover, workflows are clearer.
- **Scalable**: Whether you're running one project or thirty, the console helps you manage at any level.
- **Production-ready**: A design that reflects the maturity of the platform you're running on.
- **Empowering**: A console that doesn't just show you state, but teaches you how to get more out of Shuttle.
## Check It Out
The new console is live today. Log in to your account (or create one if you're new) and see what's changed.
We built this console with you: your feedback, your workflows, your needs. Now we'd love to hear what you think.
👉 [Log in or sign up to explore the new console](https://console.shuttle.dev?utm_source=website&utm_medium=blog&utm_campaign=new_console_1)
---
# How to Build and Deploy an SSE MCP Server with OAuth in Rust
Source: https://www.shuttle.dev/blog/2025/08/13/sse-mcp-server-with-oauth-in-rust
Date: 13 August 2025
Author: dcodes
Tags: rust, mcp, sse, oauth, axum, shuttle, sqlx
Build an SSE-based MCP server with OAuth 2 in Rust using rmcp and Axum and deploy to Shuttle with PostgreSQL/SQLx.
AI agents have become integral to modern development workflows, transforming how we build and maintain software. While these tools are already powerful, they reach their full potential when enhanced with [MCP (Model Context Protocol)](https://modelcontextprotocol.io/) servers that extend their capabilities through specialized tools and integrations.
For developers running hosted applications or platforms, MCP servers offer a unique opportunity to provide users with natural language interfaces to your services. Consider a project management platform: instead of navigating through multiple screens, users could authorize an MCP server and then create tasks, update project statuses, or generate reports using simple conversational commands through their preferred AI client.
Building secure MCP servers requires adherence to two critical standards: the Model Context Protocol specification and [OAuth 2.1](https://datatracker.ietf.org/doc/html/draft-ietf-oauth-v2-1-13). When implemented correctly, your MCP server becomes universally compatible with any MCP-enabled AI tool—whether users prefer [Cursor](https://cursor.sh/), [Claude Desktop](https://claude.ai/desktop), Windsurf, or other platforms.
This tutorial provides a comprehensive guide to OAuth authentication patterns and walks through building a production-ready MCP server. We'll implement secure authentication flows that allow AI agents to safely interact with your hosted services, then deploy the complete solution using [Shuttle's](https://shuttle.dev/) streamlined cloud deployment.
## MCP Transport Types
MCP servers use two transport mechanisms: [**STDIO**](https://modelcontextprotocol.io/specification/2025-06-18/basic/transports#stdio) (standard input/output) and [**SSE**](https://modelcontextprotocol.io/specification/2025-06-18/basic/transports#http-with-sse) (Server-Sent Events). The stdio transport runs as a local subprocess and communicates through standard input/output streams, which we covered in detail in our [comprehensive guide to building stdio MCP servers in Rust](https://www.shuttle.dev/blog/2025/07/18/how-to-build-a-stdio-mcp-server-in-rust). SSE transport type servers, on the other hand, use HTTP-based communication with Server-Sent Events for real-time messaging.
SSE servers operate as cloud-hosted services, making them accessible from anywhere with proper network connectivity. Users don't need to install anything locally—they can access your MCP server through a simple URL. SSE transport type servers integrate directly with your existing backend infrastructure and support robust authentication mechanisms like OAuth 2, enabling secure access control and user management.
This tutorial focuses on building an **SSE MCP server with OAuth**—the cloud-based approach that connects to your backend application and provides authenticated access to your services.
## Understanding OAuth 2 for MCP Servers
In order for users to authorize their MCP clients and AI agents to perform actions on their behalf, MCP servers must implement OAuth 2 specifications. In this section, we'll dive deep into the OAuth 2 requirements, what MCP clients expect, and what the flow looks like.
### OAuth Flow
The OAuth flow consists of five key phases:
1. **Discovery Phase**: Client discovers authorization server metadata
2. **Registration Phase**: Client registers itself with the authorization server
3. **Authorization Phase**: User consent and authorization code generation
4. **Token Exchange**: MCP client exchanges the authorization code for an access token and refresh token
5. **Authenticated Access**: Using access tokens to connect to the protected MCP SSE endpoints
### OAuth 2 Flow Deep Dive
OAuth might seem intimidating at first glance, but it's actually a straightforward flow once you understand the components. Let's dive into the OAuth flow.
### Step 1: Discovery Phase (Metadata Endpoint)
For MCP clients to discover your authorization server endpoints, we need to create a well-known route that MCP clients will always query before starting the authentication flow.
MCP clients query the `/.well-known/oauth-authorization-server` endpoint to retrieve the **Authorization Server Metadata** (RFC 8414). This JSON document lists your OAuth 2.0 endpoints, grant types, and scopes. Implementing it is mandatory. Without it, MCP clients can't authenticate with your server.
The metadata endpoint provides important information to the MCP client, such as:
- **Registration endpoint**: The route where MCP clients can register themselves with your authorization server.
- **Authorization endpoint**: The MCP client will redirect the user to this route so that the user can manually review the authorization request and approve or reject it.
- **Token endpoint**: After the user approves the authorization request, the MCP client will exchange the authorization code (generated by the server in the previous step) for an access token, this token will be used for authenticated requests from the MCP client to the MCP server.
### Step 2: Registration Phase
During the initial connection setup, the MCP client first discovers the authorization server endpoints via the metadata endpoint, then makes a request to the **registration endpoint**, providing relevant information about itself. The server saves this information in the database and responds with a **client ID** and **client secret** for the MCP client.
### Step 3: Authorization Phase (User Consent)
The first time an MCP server is added to an MCP client, the server cannot be used until the user authenticates with it, here is an example of how the Notion MCP server looks in Cursor:
When the user clicks on the **Login** button through their MCP client, the MCP client will redirect the user to the **authorization endpoint** that was provided using the **metadata endpoint**.
The user can then authenticate using their existing account and approve the authorization request. After successful authentication, the server redirects the user back to the MCP client with an **authorization code** in the URL.
### Step 4: Token Exchange
After the user approves the authorization request, the MCP client immediately uses the **authorization code** to make a request to the **token endpoint**, exchanging the code for an **access token** and **refresh token**. The access token authenticates the MCP client to the MCP server, while the refresh token renews the access token when it expires.
The MCP client will now be able to make authenticated requests and ready for use.
### Step 5: Authenticated Access
The MCP client with the use of the access token will now be able to connect to the MCP server and the MCP server will have the ability to identify the MCP client and the user that authorized it.
### Refreshing the Access Token
The refresh token is used to renew the access token when it expires. The token endpoint must be designed to support both the refresh token grant type and the authorization code grant type, which we'll implement later in the tutorial.
## Building and Deploying an SSE MCP Server in Rust
Now that we have a solid understanding of MCP servers and OAuth integration, we'll build a production-ready SSE MCP server that fully complies with both the MCP protocol and OAuth 2 specifications.
After building and testing the MCP server, we'll then deploy it to the cloud using **Shuttle** with just a single command.
You can find the complete code for this project in the [GitHub repository](https://github.com/shuttle-hq/shuttle-examples/tree/main/mcp/mcp-sse-oauth).
### Prerequisites
To follow along, you'll need:
- Intermediate Rust familiarity (async/await, Axum, traits)
- Basic OAuth concepts (auth codes, tokens, etc.)
- Experience with PostgreSQL and SQLx
This tutorial focuses on key patterns. For the complete, unabridged code, please refer to the accompanying [repository](https://github.com/shuttle-hq/shuttle-examples/tree/main/mcp/mcp-sse-oauth).
### Using the MCP Inspector
The MCP inspector is a tool provided by the MCP team to help you test and debug your MCP server. You need [Node.js](https://nodejs.org/en/download) and npm installed on your machine to run it. Execute the following command to install and run the MCP inspector in your terminal:
```bash
npx @modelcontextprotocol/inspector
```
This will automatically open the inspector in your default browser:
We'll use the MCP inspector to test our OAuth flow at each stage of the tutorial
Click the "Open Auth Settings" button which will open the auth settings page that tests the OAuth steps.
First, we'll implement the metadata endpoint. We'll build our server using the official `rmcp` crate and Axum, which are compatible out of the box.
Add the `rmcp` crate to your `Cargo.toml` file:
```toml
[dependencies]
rmcp = { version = "0.5", features = ["server", "transport-sse-server", "auth"] }
```
The feature flags are self-explanatory: we need the `server` flag to build an MCP server (not a client), `transport-sse-server` for SSE transport functionality, and `auth` for OAuth server utilities.
In our `main.rs` file, we have **Shuttle** boilerplate code that provisions a [PostgreSQL database](https://docs.shuttle.dev/resources/shuttle-shared-db) in production and implements the Shuttle [Service Trait](https://docs.rs/shuttle-service/0.56.0/shuttle_service/trait.Service.html) to get the socket address and run the MCP server, The `Service` trait ensures that the code will work in both development and production environments. We'll write the rest of the code in the `init.rs` file as the entry point for our backend server which will serve the authentication APIs and the MCP server endpoints.
```rust
struct McpSseService {
pool: PgPool,
secrets: shuttle_runtime::SecretStore,
}
#[shuttle_runtime::async_trait]
impl shuttle_runtime::Service for McpSseService {
async fn bind(self, addr: SocketAddr) -> Result<(), shuttle_runtime::Error> {
init::init(addr, self.pool, self.secrets).await
}
}
#[shuttle_runtime::main]
async fn main(
#[shuttle_shared_db::Postgres(
local_uri = "postgres://postgres:password@localhost:5432/mcp-sse-auth"
)]
pool: PgPool,
#[shuttle_runtime::Secrets] secrets: shuttle_runtime::SecretStore,
) -> Result {
Ok(McpSseService { pool, secrets })
}
```
We use the `shuttle_shared_db::Postgres` macro to provision a PostgreSQL database in production and `local_uri` to connect to a local database for development purposes only. The `shuttle_runtime::Secrets` macro is used to access secrets from the `Secrets.toml` file for development as well as deployment, which we'll create in the next step.
The `init()` function contains all the `rmcp` boilerplate required to spin up the SSE transport MCP server. You can view the [complete implementation here](https://github.com/shuttle-hq/shuttle-examples/blob/main/mcp/mcp-sse-oauth/src/init.rs).
### Creating the Secrets File
Shuttle uses `Secrets.toml` files to store project secrets. We'll create two files: `Secrets.toml` for production and `Secrets.dev.toml` for development in the project root. We'll use the `openssl` command to generate a random JWT secret key. Run the following command to generate a secure key:
> Security Note: Never commit your Secrets.toml files to version control. Add them to your .gitignore file to prevent accidental exposure of sensitive information.
```bash
openssl rand -base64 32
# Output: sQGnE/aD76G2TAJA6HqJk9shkmYwsmwZ3b+sJlQWBVE=
```
Update your `Secrets.dev.toml` file, e.g.
```toml
BASE_URL = "http://localhost:8000"
JWT_SECRET = "sQGnE/aD76G2TAJA6HqJk9shkmYwsmwZ3b+sJlQWBVE=" # Replace with your own JWT secret key
```
You can get your production URL by navigating to the [Shuttle Console](https://console.shuttle.dev/) and bootstrap a new project. The URL will be displayed in the console.
Generate another random JWT secret key and update your `Secrets.toml` file as well, e.g.
```toml
BASE_URL = "https://your-project.shuttle.app" # Add your production URL here
JWT_SECRET = "FgaRCPwUd86iRwQsAm9faAky59ghk0c3bhSijz9wbAM=" # Replace with your own JWT secret key
```
### Running the Development Server
After **Shuttle** and **rmcp** boilerplate is set up, we can run the development server:
```bash
shuttle run --secrets Secrets.dev.toml
```
For an auto-reload development server, you can use [cargo-watch](https://crates.io/crates/cargo-watch) to run the following command:
```bash
cargo watch -x "shuttle run --secrets Secrets.dev.toml"
```
This automatically restarts the server when you make code changes. You'll need to install [cargo-watch](https://crates.io/crates/cargo-watch) first by running `cargo install cargo-watch --locked`.
Excellent! Our MCP server is now running on `http://127.0.0.1:8000` and we can test it using the MCP inspector.
Update your MCP inspector to use the correct MCP server URL, in our case it's `http://127.0.0.1:8000/mcp/sse`:
The reason our MCP server is running on `http://127.0.0.1:8000/mcp/sse` is because how we configured the the rmcp boilerplate code:
```rust
let sse_config = SseServerConfig {
bind: addr,
sse_path: "/mcp/sse".to_string(),
post_path: "/mcp/message".to_string(),
ct: CancellationToken::new(),
sse_keep_alive: Some(Duration::from_secs(15)),
};
```
Using this configuration, we've specified the MCP server to run on `http://127.0.0.1:8000/mcp/sse`.
### Setting Up the Metadata Endpoint
Clients can connect to the server but can't authenticate yet. To fix this, we'll start with the discovery phase by implementing the **`/.well-known/oauth-authorization-server`** route. Clients use this endpoint to fetch auth metadata, and since `rmcp` is compatible with Axum, we can easily create this route to return a JSON response.
According to the OAuth 2 specification, the metadata is expected to include the following fields:
- `issuer`: The base URL of the authorization server. e.g. `https://my-app.shuttle.app`.
- `registration_endpoint`: MCP clients can register themselves with the authorization server.
- `authorization_endpoint`: MCP clients will redirect the user to this route so that the user can manually review the authorization request and approve or reject it.
- `token_endpoint`: MCP clients will use this route to exchange the authorization code for an access token and refresh token, this route will be re-used for refreshing the access token when it expires.
- `scopes_supported`: The scopes supported by the authorization server. e.g. `profile`, `email`, `mcp`.
- `additional_fields`: Additional fields that can be used to customize the authorization server (according to the RFC 8414).
- `jwks_uri`: The URL of the [JSON Web Key Set (JWKS)](https://datatracker.ietf.org/doc/html/rfc7517) endpoint, this is optional and can be omitted if not needed.
Let's implement the metadata endpoint:
```rust
pub async fn oauth_authorization_server(State(state): State>) -> impl IntoResponse {
let base_url = state
.secrets
.get("BASE_URL")
.expect("BASE_URL secret not found");
let mut additional_fields = HashMap::new();
additional_fields.insert(
"response_types_supported".into(),
Value::Array(vec![Value::String("code".into())]),
);
additional_fields.insert(
"code_challenge_methods_supported".into(),
Value::Array(vec![Value::String("S256".into())]),
);
let metadata = AuthorizationMetadata {
issuer: Some(base_url.clone()),
registration_endpoint: format!("{base_url}/oauth/register"),
authorization_endpoint: format!("{base_url}/oauth/authorize"),
token_endpoint: format!("{base_url}/oauth/token"),
scopes_supported: Some(vec!["profile".to_string(), "email".to_string()]),
jwks_uri: None,
additional_fields,
};
(StatusCode::OK, Json(metadata)).into_response()
}
```
We've added the following fields to advertise our support for the Authorization Code grant with PKCE (S256), in compliance with RFC 8414.
```rust
let mut additional_fields = HashMap::new();
additional_fields.insert(
"response_types_supported".into(),
Value::Array(vec![Value::String("code".into())]),
);
additional_fields.insert(
"code_challenge_methods_supported".into(),
Value::Array(vec![Value::String("S256".into())]),
);
```
Let's test it with the MCP inspector:
Excellent! The metadata endpoint is working. Now let's implement the registration endpoint.
### Setting Up the Registration Route
After using the metadata endpoint, MCP clients register themselves by sending a request to the Register Route. The server saves the client's information to the database and responds with a `client_id` and `client_secret`.
First, we need a helper function to generate secure client secrets:
```rust
fn generate_client_secret() -> String {
use std::fmt::Write;
let mut secret = String::new();
for _ in 0..32 {
let byte: u8 = rand::random();
write!(&mut secret, "{byte:02x}").unwrap();
}
secret
}
```
Now the registration handler:
```rust
#[derive(Debug, Deserialize)]
pub struct ClientRegistrationRequest {
pub client_name: Option,
pub redirect_uris: Vec,
pub scope: Option,
}
pub async fn client_registration(
State(state): State>,
Json(request): Json,
) -> impl IntoResponse {
// Validate redirect URIs
if request.redirect_uris.is_empty() {
return (StatusCode::BAD_REQUEST, Json(serde_json::json!({
"error": "invalid_request",
"error_description": "redirect_uris is required and must not be empty"
}))).into_response();
}
// Generate client credentials
let client_id = Uuid::new_v4().to_string();
let client_secret = generate_client_secret();
let client_name = request
.client_name
.unwrap_or_else(|| "MCP Client".to_string());
let issued_at = chrono::Utc::now().timestamp();
let expires_at = chrono::Utc::now() + chrono::Duration::days(90);
// Store client in database
let query_result = sqlx::query!(
r#"
INSERT INTO mcp_clients (client_id, client_secret, client_name, redirect_uris, client_secret_expires_at)
VALUES ($1, $2, $3, $4, $5)
"#,
client_id,
client_secret,
client_name,
&request.redirect_uris,
expires_at
)
.execute(&state.pool)
.await;
match query_result {
Ok(_) => {
let response = ClientRegistrationResponse {
client_id: client_id.clone(),
client_secret,
client_name,
redirect_uris: request.redirect_uris,
scope: "mcp".to_string(),
client_id_issued_at: issued_at,
client_secret_expires_at: expires_at.timestamp(),
};
(StatusCode::CREATED, Json(response)).into_response()
}
Err(e) => {
error!("Failed to register client: {}", e);
(
StatusCode::INTERNAL_SERVER_ERROR,
Json(serde_json::json!({
"error": "server_error",
"error_description": "Failed to register client"
})),
)
.into_response()
}
}
}
```
Let's test our registration endpoint to make sure it's working correctly.
The registration endpoint is working. Now let's implement the authorization endpoint.
### Setting Up the Authorization Endpoint
The authorization endpoint shows the user a consent screen with the requested scopes. When the user clicks "Allow," the server does three things:
- Generates an authorization code.
- Saves the code to the database.
- Redirects the user back to the client with the code.
Finally, the client exchanges this authorization code for an access token and a refresh token.
> Note: In a real-world app, you would require users to be logged in before they see the consent screen, the `authorize_get` and `authorized_post` routes must be protected by your applications authentication mechanism i.e. a middleware.
> For simplicity in this tutorial, we're skipping that login step. We'll simply use the `client_id` as the user identifier to keep things simple
For the frontend, we'll use the template engine [Askama](https://github.com/askama-rs/askama) to render the consent UI. We've already created an HTML template that you can find in the [repository](https://github.com/shuttle-hq/shuttle-examples/tree/main/mcp/mcp-sse-oauth/templates). Using the `askama` crate, we can create a struct for template rendering and then render the template using the `render` method.
```rust
#[derive(Template)]
#[template(path = "authorize.html")]
struct AuthorizeTemplate {
client_id: String,
client_name: String,
redirect_uri: String,
scope: String,
scopes: Vec,
code_challenge: String,
code_challenge_method: String,
state: String,
}
```
We need to use the derive macro `#[derive(Template)]` to register the template and the `#[template(path = "authorize.html")]` attribute to specify the template file path.
After that, we can send the rendered template as an HTML response using the `axum::response::Html` type.
```rust
pub async fn authorize_get(
Query(params): Query,
State(state): State>,
) -> impl IntoResponse {
// Validate required parameters
if params.response_type != "code" {
return (
StatusCode::BAD_REQUEST,
Html("Unsupported response type".to_string()),
)
.into_response();
}
// Look up client in database
let client_result = sqlx::query!(
"SELECT client_name FROM mcp_clients WHERE client_id = $1",
params.client_id
)
.fetch_optional(&state.pool)
.await;
let client = match client_result {
Ok(Some(client)) => client,
Ok(None) => {
return (StatusCode::BAD_REQUEST, Html("Invalid client".to_string())).into_response()
}
Err(e) => {
error!("Database error: {}", e);
return (
StatusCode::INTERNAL_SERVER_ERROR,
Html("Internal server error".to_string()),
)
.into_response();
}
};
let scope = params.scope.unwrap_or_else(|| "profile email".to_string());
let scopes: Vec = scope.split_whitespace().map(|s| s.to_string()).collect();
let template = AuthorizeTemplate {
client_id: params.client_id,
client_name: client.client_name,
redirect_uri: params.redirect_uri,
scope: scope.clone(),
scopes,
code_challenge: params.code_challenge,
code_challenge_method: params.code_challenge_method,
state: params.state.unwrap_or_default(),
};
match template.render() {
Ok(html) => Html(html).into_response(),
Err(e) => {
error!("Template render error: {}", e);
(
StatusCode::INTERNAL_SERVER_ERROR,
Html("Template error".to_string()),
)
.into_response()
}
}
}
```
Next, let's handle the authorization click. When a user approves the request, our server will:
- Generate an **authorization code** and save it to the database.
- Redirect the user back to the client using the provided `redirect_uri`.
```rust
pub async fn authorize_post(
State(state): State>,
Form(form): Form,
) -> impl IntoResponse {
if form.action == "deny" {
let mut redirect_url = format!("{}?error=access_denied", form.redirect_uri);
if let Some(state) = form.state {
redirect_url.push_str(&format!("&state={state}"));
}
return Redirect::to(&redirect_url).into_response();
}
// Generate authorization code
let auth_code = generate_authorization_code();
let expires_at = Utc::now() + Duration::minutes(10); // 10 minute expiration
// Store authorization code in database
let store_result = sqlx::query!(
r#"
INSERT INTO authorization_codes (code, client_id, redirect_uri, code_challenge, expires_at)
VALUES ($1, $2, $3, $4, $5)
"#,
auth_code,
form.client_id,
form.redirect_uri,
form.code_challenge,
expires_at
)
.execute(&state.pool)
.await;
match store_result {
Ok(_) => {
let mut redirect_url = format!("{}?code={}", form.redirect_uri, auth_code);
if let Some(state) = form.state {
redirect_url.push_str(&format!("&state={state}"));
}
Redirect::to(&redirect_url).into_response()
}
Err(e) => {
error!("Failed to store authorization code: {}", e);
let mut redirect_url = format!("{}?error=server_error", form.redirect_uri);
if let Some(state) = form.state {
redirect_url.push_str(&format!("&state={state}"));
}
Redirect::to(&redirect_url).into_response()
}
}
}
```
Let's test our authorization endpoint with the MCP inspector:
The inspector displays the backend authorization URL we just created, which you can open in a browser to see the consent UI.
Click "Authorize"
The inspector now **displays** the **authorization code** from the backend, which we'll use in the next step.
All steps done for this phase, let's move on to the next step which is the token endpoint.
### Implementing Token Exchange
So far, the user has authorized the client and been redirected back with an authorization code.
Next, the client must exchange that authorization code for an actual access token. It does this by making a POST request to our token endpoint.
To be fully compliant with OAuth 2.0, this single endpoint needs to handle two different grant types:
- Exchanging the initial authorization code for tokens.
- Exchanging a refresh token for a new access token later on.
To handle this, we'll build two main functions:
- `handle_authorization_code_grant`: This function will validate the incoming authorization code and PKCE verifier from the database. If they are valid, it creates the first access token and refresh token.
- `handle_refresh_token_grant`: This function validates an existing refresh token. If it's valid, it issues a new access token and implements token rotation. This is a security best practice where a new refresh token is also issued, invalidating the old one.
```rust
pub async fn token_post(
State(state): State>,
Form(request): Form,
) -> impl IntoResponse {
match request.grant_type.as_str() {
"authorization_code" => handle_authorization_code_grant(state, request)
.await
.into_response(),
"refresh_token" => handle_refresh_token_grant(state, request)
.await
.into_response(),
_ => {
let error = ErrorResponse {
error: "unsupported_grant_type".to_string(),
error_description: Some(
"Only authorization_code and refresh_token grant types are supported"
.to_string(),
),
};
(StatusCode::BAD_REQUEST, Json(error)).into_response()
}
}
}
```
See the [full implementation here](https://github.com/shuttle-hq/shuttle-examples/blob/main/mcp/mcp-sse-oauth/src/auth/token.rs).
Let's test our token endpoint with the MCP inspector:
Perfect! All steps done for the OAuth 2.0 authentication, and we're ready to move on to the next step which is creating a middleware to protect the MCP endpoint.
### Implementing JWT Authentication Middleware
To secure our MCP service, we need to validate the JWT on every request made by a client. We'll use a middleware to handle this, ensuring only authenticated clients can access our MCP tools:
### JWT Claims Structure
The JWT we generated earlier contains the `client_id`. By decoding this token on every incoming request, we can extract the `client_id` to identify which client is making the call.
First, we'll define a struct that mirrors the **JWT claims** we generated at the token endpoint:
```rust
#[derive(Debug, Serialize, Deserialize)]
pub struct Claims {
pub sub: String, // client_id
pub iat: i64, // issued at
pub exp: i64, // expires at
pub scope: String, // granted scopes
}
```
### Token Validation Middleware
The middleware extracts and validates JWT tokens from the Authorization header:
```rust
pub async fn validate_token_middleware(
State(state): State>,
mut request: Request,
next: Next,
) -> Response {
// Extract the access token from the Authorization header
let auth_header = request.headers().get("Authorization");
let token = match auth_header {
Some(header) => {
let header_str = match header.to_str() {
Ok(s) => s,
Err(_) => {
error!("Invalid Authorization header encoding");
return StatusCode::UNAUTHORIZED.into_response();
}
};
if let Some(stripped) = header_str.strip_prefix("Bearer ") {
stripped.to_string()
} else {
error!("Authorization header missing Bearer prefix");
return StatusCode::UNAUTHORIZED.into_response();
}
}
None => {
error!("Missing Authorization header");
return StatusCode::UNAUTHORIZED.into_response();
}
};
// Get JWT secret from configuration
let jwt_secret = state
.secrets
.get("JWT_SECRET")
.expect("JWT_SECRET secret not found");
// Validate JWT token
let key = DecodingKey::from_secret(jwt_secret.as_bytes());
let validation = Validation::default();
match decode::(&token, &key, &validation) {
Ok(token_data) => {
// Check if token is expired (JWT validation already handles this, but being explicit)
let now = chrono::Utc::now().timestamp();
if token_data.claims.exp < now {
error!("Token has expired");
return StatusCode::UNAUTHORIZED.into_response();
}
// Verify the client still exists in database
let client_exists = sqlx::query!(
"SELECT client_id FROM mcp_clients WHERE client_id = $1",
token_data.claims.sub
)
.fetch_optional(&state.pool)
.await;
match client_exists {
Ok(Some(_)) => {
// Add client_id to request extensions for downstream handlers
request.extensions_mut().insert(token_data.claims.sub);
next.run(request).await
}
Ok(None) => {
error!("Client no longer exists: {}", token_data.claims.sub);
StatusCode::UNAUTHORIZED.into_response()
}
Err(e) => {
error!("Database error validating client: {}", e);
StatusCode::INTERNAL_SERVER_ERROR.into_response()
}
}
}
Err(e) => {
error!("Token validation failed: {}", e);
StatusCode::UNAUTHORIZED.into_response()
}
}
}
```
In the middleware, we extract the Bearer token and verify it's valid and not expired. Then we extract the `client_id` from it and verify the client exists in the database.
```rust
request.extensions_mut().insert(token_data.claims.sub);
```
The above code snippet is a crucial part of the middleware, we add the `client_id` to the [request extensions](https://docs.rs/axum/latest/axum/middleware/index.html#passing-state-from-middleware-to-handlers) so it can be used by the next handlers and MCP tools.
### Defining the service struct
We will define our entire service within a central `struct`. This approach allows us to implement the necessary `rmcp` traits and macros, which will contain all of our MCP logic like [tools](https://modelcontextprotocol.io/specification/2025-06-18/server/tools), [resources](https://modelcontextprotocol.io/specification/2025-06-18/server/resources), [prompts](https://modelcontextprotocol.io/specification/2025-06-18/server/prompts), etc.
```rust
use tokio::sync::Mutex;
use std::sync::Arc;
#[derive(Clone)]
pub struct TodoService {
db_pool: Arc,
tool_router: ToolRouter,
client_id: Arc>>,
}
```
The `client_id` here is key because it will be used to identify the client that made the request in every tool call.
### Server Handler Implementation
Next, we'll implement the `ServerHandler` trait. This trait handles core protocol logic and ensures our server is compliant without having to manage the low-level details.
It has many methods, but most of them are optional.
To get our server running, we only need to implement the following:
- `initialize`: Handles the initial setup when a client connects.
- `get_info`: Provides essential metadata about our service.
We'll ignore the other optional methods like `ping`, `list_prompts`, and `list_resources` for the time being.
### Implementing `get_info`
The `get_info` method is used to provide metadata about our MCP service, MCP clients will fetch this metadata and the AI model will understand what this MCP server is used for.
```rust
#[tool_handler]
impl ServerHandler for TodoService {
fn get_info(&self) -> ServerInfo {
ServerInfo {
protocol_version: ProtocolVersion::V_2024_11_05,
capabilities: ServerCapabilities::builder()
.enable_prompts()
.enable_resources()
.enable_tools()
.build(),
server_info: Implementation::from_build_env(),
instructions: Some("This server provides todo management tools. You can create, read, update, and delete todos. Each todo has an id, title, and completion status.".to_string()),
}
}
}
```
### Implementing `initialize` method
The `initialize` method executes on initial MCP client-server connection. Running post-JWT middleware, it extracts the `client_id` from middleware extensions and caches it for subsequent operations.
```rust
#[tool_handler]
impl ServerHandler for TodoService {
...
async fn initialize(
&self,
_request: InitializeRequestParam,
context: RequestContext,
) -> Result {
if let Some(http_request_part) = context.extensions.get::() {
if let Some(client_id) = http_request_part.extensions.get::() {
let mut writer = self.client_id.lock().await;
*writer = Some(client_id.clone());
} else {
tracing::warn!("No client_id found in HTTP request extensions");
}
}
Ok(self.get_info())
}
}
```
Authentication for persistent SSE connections works differently than for standard HTTP requests. We validate the JWT only once when the connection is first established via the `initialize` method. All subsequent messages on that same connection are then considered authenticated
The `initialize` method's signature takes `&self` (an immutable reference), not `&mut self`. This presents a challenge: we're not allowed to directly change our service's state (like setting the `client_id`) from within the method.
To work around this restriction, we use a pattern called interior mutability. We wrap our `client_id` in two special types that allow for safe modification even from an immutable context:
- `Arc`: Allows the data to be safely owned and shared across multiple asynchronous tasks.
- `tokio::sync::Mutex`: Acts as a lock that ensures only one task can access and change the data at a time.
This combination lets us safely mutate the value from within a method that only has a `&self`
### Building the MCP Todo Service
Let's do a quick recap of how the connection is being handled so far:
- The MCP client requests OAuth metadata.
- User clicks the login button presented by the MCP client.
- User is redirected to the authorization endpoint.
- User **Authorizes** the MCP client.
- Server redirects the user back to the MCP client with the authorization code.
- MCP client exchanges the authorization code for the access token and refresh token.
- MCP client establishes a persistent connection to the MCP endpoint (i.e `/mcp/sse`) using the access token as a Bearer token in the `Authorization` header.
- The JWT middleware validates the access token and extract the `client_id` from it.
- The `TodoService` has now access to the `client_id` and can use it to perform actions on behalf of the user.
### Implementing the MCP tools
MCP tools work like regular functions: they have names, input parameters, and outputs. When AI agents call these tools, they pass the required parameters and receive results back through the JSON-RPC 2.0 protocol.
The `rmcp` crate simplifies schema generation by using `schemars` to create JSON-RPC 2.0 compatible schemas automatically. With the derive macro, we can implement the `JsonSchema` trait and generate tool schemas without manual work.
For our todo creation tool, we need just a `title` field and an optional `completed` field. The tool returns a success message confirming the operation.
```rust
#[derive(Debug, Serialize, Deserialize, rmcp::schemars::JsonSchema)]
pub struct CreateTodoInput {
pub title: String,
pub completed: Option,
}
```
### Implementing MCP Tools
The `rmcp` library provides powerful macros to automatically generate MCP tools. The `#[tool_router]` macro creates a router for all our tools, while `#[tool]` generates individual tool handlers:
```rust
#[tool_router]
impl TodoService {
pub fn new(db_pool: Arc) -> Self {
Self {
db_pool,
tool_router: Self::tool_router(),
client_id: Arc::new(tokio::sync::Mutex::new(None)),
}
}
#[tool(description = "Create a new todo item")]
async fn create_todo(
&self,
Parameters(input): Parameters,
) -> Result {
// Extract client_id for user-specific data operations
let client_id = {
let reader = self.client_id.lock().await;
reader.clone().ok_or_else(|| {
McpError::internal_error("Client not authenticated".to_string(), None)
})?
};
let request = CreateTodoRequest {
title: input.title,
completed: input.completed,
};
// Pass client_id to database operations for user isolation
match db::create_todo(&self.db_pool, request, &client_id).await {
Ok(todo) => {
let todo_json = serde_json::to_string_pretty(&todo).map_err(|e| {
McpError::internal_error(format!("Serialization error: {e}"), None)
})?;
Ok(CallToolResult::success(vec![Content::text(format!(
"Todo created successfully:\\n{todo_json}"
))]))
}
Err(e) => Err(McpError::internal_error(
format!("Failed to create todo: {e}"),
None,
)),
}
}
// Other tools: get_todo, list_todos, update_todo, delete_todo...
}
```
The database query for creating a todo item:
```rust
pub async fn create_todo(
pool: &PgPool,
request: CreateTodoRequest,
client_id: &str,
) -> Result {
let row = sqlx::query!(
r#"
INSERT INTO todos (title, completed, client_id)
VALUES ($1, COALESCE($2, FALSE), $3)
RETURNING id, title, completed
"#,
request.title,
request.completed,
client_id
)
.fetch_one(pool)
.await?;
Ok(Todo {
id: row.id,
title: row.title,
completed: row.completed,
})
}
```
## Integrating the SSE Server
So far, we've defined our `MCP` service `struct`, implemented the `ServerHandler` trait, and used the `#[tool_router]` macro to register our tools. Now, we need to integrate this service into an SSE server so it can be accessed from a URL.
```rust
pub async fn init(
addr: SocketAddr,
pool: PgPool,
secrets: shuttle_runtime::SecretStore,
) -> Result<(), shuttle_runtime::Error> {
// ---- Other boilerplate code ----
// Create SSE server configuration for MCP
let sse_config = SseServerConfig {
bind: addr,
sse_path: "/mcp/sse".to_string(),
post_path: "/mcp/message".to_string(),
ct: CancellationToken::new(),
sse_keep_alive: Some(Duration::from_secs(15)),
};
// Create SSE server
let (sse_server, sse_router) = SseServer::new(sse_config);
// Create protected SSE routes (require authorization)
let protected_sse_router = sse_router.layer(middleware::from_fn_with_state(
app_state.clone(),
// Applying the middleware for authentication
validate_token_middleware,
));
// Create HTTP router with auth routes (non-protected) and protected SSE router
let app = Router::new()
.merge(auth_router)
.with_state(app_state.clone())
.merge(protected_sse_router)
.layer(cors_layer);
// Add the `TodoService` we created to the SSE server
sse_server.with_service(move || TodoService::new(Arc::new(app_state.pool.clone())));
// ---- Other boilerplate code to start the server ----
Ok(())
}
```
The middleware is applied to make sure only authenticated clients can access the MCP route:
```rust
let protected_sse_router = sse_router.layer(middleware::from_fn_with_state(
app_state.clone(),
// Applying the middleware for authentication
validate_token_middleware,
));
```
We also used Axum's `with_service` method to attach our `TodoService` to the route. This makes our service available to any client that connects to the SSE server.
```rust
sse_server.with_service(move || TodoService::new(Arc::new(app_state.pool.clone())));
```
## Deployment and Testing
Deploy to Shuttle with a single command:
```bash
shuttle deploy
```
### Adding to MCP Clients
Follow the instructions below to connect your specific MCP client to the server:
**Cursor Configuration:**
```json
{
"mcpServers": {
"Todo List": {
"url": "https://your-server.shuttle.app/mcp/sse"
}
}
}
```
In Cursor, navigate to the Tools page within the Settings menu. Then click the **"Login"** button to authenticate with the MCP server.
This will redirect you to the authorization page that we created.
After authorizing the client, you'll be redirected to Cursor, which will now have access to the MCP tools on your account.
Perfect! 🎉 Our MCP server is now hosted and ready to use by Cursor. The same process applies to any other MCP client, such as Claude Code or Windsurf.
## Conclusion
We've successfully built a production-ready MCP server with the SSE transport type that combines the power of Server-Sent Events with robust OAuth 2 authentication. This project demonstrates how to create secure, real-time AI tool access that goes far beyond a simple local setup.
Our implementation delivers a complete OAuth 2 flow to secure all client interactions. The SSE-based protocol enables instant tool communication, while the authorization layer ensures that actions are performed securely on behalf of specific users. The entire system, backed by **PostgreSQL**, deploys seamlessly to **Shuttle**, providing a solid foundation for building any real-world MCP service.
Pushing future updates is as simple as running `shuttle deploy`, and you can easily integrate this command into a [CI/CD pipeline](https://docs.shuttle.dev/integrations/ci-cd) to fully automate the process.
The combination of Rust's performance, Shuttle's deployment simplicity, and MCP's standardized protocol creates a compelling stack for modern AI tooling infrastructure that scales from prototype to production without compromise.
## Try it Yourself
Ready to build your own SSE MCP server? Run the following command to clone the complete project and deploy with one command:
```bash
# Clone the project
shuttle init --from shuttle-hq/shuttle-examples --subfolder mcp/mcp-sse-oauth
# Navigate to the project directory
cd mcp-sse-oauth
# Deploy the project
shuttle deploy
```
Read the [Shuttle documentation](https://docs.shuttle.dev) for more information. Happy coding!
---
# How to Build a stdio MCP Server in Rust
Source: https://www.shuttle.dev/blog/2025/07/18/how-to-build-a-stdio-mcp-server-in-rust
Date: 21 July 2025
Author: dcodes
Tags: rust, mcp, ai, dns, stdio, server
Learn how to build MCP server in Rust using the rmcp crate. This MCP server development guide covers stdio MCP server creation, DNS lookup MCP implementation, and AI agent extension with Model Context Protocol Rust SDK.
## Introduction
AI agents are transforming how we work, but they're often limited by their training data. [MCP (Model Context Protocol)](https://modelcontextprotocol.io/) servers bridge this gap by giving AI agents access to real-time data, external APIs, and custom tools.
Building your own MCP server lets you extend AI capabilities with your specific tools and services. In this guide, we'll create a DNS lookup MCP server in **Rust** that demonstrates these concepts in action.
Our MCP server will perform DNS lookups and provide real-time internet data to AI agents. Since AI models can't directly access external data sources, the server acts as a bridge, delivering live DNS information that extends the agent's capabilities beyond its training data.
## What is MCP?
**MCP** stands for **Model Context Protocol**, it's a protocol that allows AI models to securely access external tools and data sources. This is extremely useful, because the AI agents will not be limited to the data they were trained on, in fact they'll be able to access external data and resources plus the ability to use tools and make API calls to external services.
Once you build an MCP server, it can be used by any MCP client, like **Cursor** and **Claude Code**, or any other MCP client that supports the MCP protocol like chatbots and conversational agents. The protocol is a standard, so you can use the same MCP server with different clients.
### MCP Transport Types
MCP servers use two transport mechanisms: **stdio** (standard input/output) and **SSE** (Server-Sent Events). The stdio transport communicates through standard input/output, similar to [LSP (Language Server Protocol)](https://microsoft.github.io/language-server-protocol/) servers, making it fast and efficient for local use. These servers are installed locally and have full access to your machine, for example they can interact with the file system, execute shell commands, access databases, or interact with any local services.
SSE servers run externally in the cloud and connect via WebSockets. While they offer more scalability, they require network setup and don't have access to your local machine's resources.
This tutorial focuses on building a **stdio MCP server** - the simpler approach that's perfect for local development and personal AI workflows.
## Building stdio MCP Server in Rust
In this tutorial, we're going to build a simple MCP server using the stdio transport that allows AI agents to perform DNS lookups.
We'll use the **HackerTarget** API (a public service that provides DNS lookup capabilities) to perform the DNS lookups and return the results back to the AI agent.
The workflow is as follows:
1. AI agent asks the MCP server to perform a DNS lookup with a parameter: `domain`
2. MCP server will use the **HackerTarget** API to perform the DNS lookup
3. MCP server will return the results back to the AI agent
4. The AI agent will read the real-time results, providing important context for the next steps
### Setting Up the Project
Now that we have laid out the plan and workflow, let's start building the **MCP server**.
First, we need to create a new Rust project.
```bash
cargo new dns-lookup-mcp-server
cd dns-lookup-mcp-server
```
Let's install the required dependencies for the project, the [Model Context Protocol](https://modelcontextprotocol.io/) provides an official SDK for **Rust** called `rmcp`. You can find the Rust SDK for MCP here: [github.com/modelcontextprotocol/rust-sdk](https://github.com/modelcontextprotocol/rust-sdk).
Add the following dependencies to your `Cargo.toml`:
```toml
[package]
name = "dns-lookup-mcp-server"
version = "0.1.0"
edition = "2021"
[dependencies]
tokio = { version = "1", features = ["full"] }
rmcp = { version = "0.3", features = ["server", "transport-io"] }
serde = { version = "1", features = ["derive"] }
reqwest = "0.12"
anyhow = "1.0"
schemars = "1.0"
```
- `serde` crate to serialize and deserialize JSON-RPC (JSON Remote Procedure Call) data for MCP protocol
- `tokio` for async operations
- `reqwest` to make HTTP requests to the DNS lookup API (HackerTarget)
- `schemars` for JSON schema generation
- `anyhow` for error handling
The `rmcp` crate provides the MCP server implementation.
## Building the DNS Service
Let's create the DNS service module. First, create a new file `src/dns_mcp.rs` and add the following code:
```rust
use rmcp::{
handler::server::{router::tool::ToolRouter, tool::Parameters},
model::{ErrorData as McpError, *},
schemars, tool, tool_handler, tool_router, ServerHandler,
};
use serde::Deserialize;
use std::{borrow::Cow, future::Future};
#[derive(Debug, Clone)]
pub struct DnsService {
tool_router: ToolRouter,
}
#[derive(Debug, Deserialize, schemars::JsonSchema)]
pub struct DnsLookupRequest {
#[schemars(description = "The domain name to lookup")]
pub domain: String,
}
#[tool_router]
impl DnsService {
pub fn new() -> Self {
Self {
tool_router: Self::tool_router(),
}
}
#[tool(description = "Perform DNS lookup for a domain name")]
async fn dns_lookup(
&self,
Parameters(request): Parameters,
) -> Result {
let response = reqwest::get(format!(
"https://api.hackertarget.com/dnslookup/?q={}",
request.domain
))
.await
.map_err(|e| McpError {
code: ErrorCode(-32603),
message: Cow::from(format!("Request failed: {}", e)),
data: None,
})?;
let text = response.text().await.map_err(|e| McpError {
code: ErrorCode(-32603),
message: Cow::from(format!("Failed to read response: {}", e)),
data: None,
})?;
Ok(CallToolResult::success(vec![Content::text(text)]))
}
}
```
The code uses several key attributes that handle MCP protocol integration:
- `#[tool_router]` wires up the MCP protocol for any methods marked with `#[tool]`.
- `#[tool(description = "...")]` exposes the function to AI models with a description for tool selection.
- `Parameters` provides type-safe parameter extraction.
- `#[schemars(description = "...")]` adds schema documentation for AI parameter generation.
## Server Configuration
To configure your MCP server, implement `ServerHandler` for metadata and apply `#[tool_handler]` to auto-generate tool discovery.
Add this to the end of `src/dns_mcp.rs`:
```rust
#[tool_handler]
impl ServerHandler for DnsService {
fn get_info(&self) -> ServerInfo {
ServerInfo {
protocol_version: ProtocolVersion::V_2024_11_05,
capabilities: ServerCapabilities::builder().enable_tools().build(),
server_info: Implementation::from_build_env(),
instructions: Some("A DNS lookup service that queries domain information using the HackerTarget API. Use the dns_lookup tool to perform DNS lookups for any domain name.".to_string()),
}
}
}
```
## Running the Server
Then, set up `stdio` communication in `src/main.rs`:
```rust
use anyhow::Result;
use dns_mcp::DnsService;
use rmcp::{transport::stdio, ServiceExt};
mod dns_mcp;
#[tokio::main]
async fn main() -> Result<()> {
// Create an instance of our DNS service
let service = DnsService::new().serve(stdio()).await?;
service.waiting().await?;
Ok(())
}
```
## Testing During Development
To speed up your development and testing, you can run the MCP server directly from your project without building a release binary. In Cursor, enable this by creating a `.cursor/mcp.json` file in your project's root directory:
```json
{
"mcpServers": {
"DNS Lookup (Dev)": {
"command": "cargo",
"args": ["run"]
}
}
}
```
> Note that configuration may vary depending on your MCP client. Check your client's documentation for the specific configuration format.
## Building for Production
To build and install the MCP server for production use:
```bash
# Build and install the binary to ~/.cargo/bin
cargo install --path .
```
This installs the `dns-lookup-mcp-server` binary to your Cargo bin directory (typically `~/.cargo/bin`), making it available system-wide if this directory is in your PATH.
## Using in Cursor
To configure the MCP server globally for Cursor, edit the main settings file located at `~/.cursor/mcp.json`:
```json
{
"mcpServers": {
"DNS Lookup": {
"command": "dns-lookup-mcp-server"
}
}
}
```
This uses the binary name directly, assuming you've installed it with `cargo install --path .` and `~/.cargo/bin` is in your PATH.
## MCP Server in Action
Time to put the MCP server to work. Let's have it check the DNS records for three domains and create a table of the results.
In the above screenshot, we asked the AI agent to query the DNS records for three domains and create a markdown table to display the results.
The AI agent was able to use the `dns_lookup` tool to perform the DNS lookup and return the results back to the user.
## Conclusion
While AI can significantly improve your development workflow, LLMs are naturally limited by their training data, knowledge cutoffs, and sandbox environment. MCP servers bridge this gap by giving AI agents access to real-time data and tools they can use when needed.
This feature is essential for data that changes too quickly for static training sets. For instance, to configure an application's networking, your AI agent needs direct access to the very latest DNS records, not outdated information. The same logic applies to other live sources, like querying a real-time database or checking an API's current status.
Rust shines as a great language for building MCP servers. Its type safety and performance characteristics make it ideal for creating reliable tools that AI models can use confidently. The `rmcp` crate's clean API combined with macros like `#[tool]` eliminates boilerplate, letting you focus on functionality rather than protocol details.
In just a few dozen lines of code, we built a production-ready DNS lookup service that works with any MCP-compatible AI client. The standardized MCP protocol means your Rust server can integrate seamlessly across different AI platforms and tools.
This is just the beginning - you can extend this pattern to build MCP servers for databases, APIs, file systems, or any external service your AI agents might need to interact with.
## Deploy your MCP server to the cloud
Ready to extend AI capabilities beyond their training data? Our **SSE MCP server template** lets you build production-ready MCP servers with your own custom logic that seamlessly integrate with any AI client:
```bash
shuttle init --from shuttle-hq/shuttle-examples --subfolder mcp/mcp-sse
```
---
# Backend Challenge: Learn Rust Microservices for the Cloud
Source: https://www.shuttle.dev/blog/2025/07/08/master-rust-microservices-cloud-shellcon-challenge
Date: 8 July 2025
Author: shuttle
Tags: rust, ai, mcp, cursor, shuttle
Build, optimise, and deploy production-ready Rust microservices on Shuttle Cloud in the free ShellCon challenge. Learn async, SQL, memory tuning and more while shipping a live, React-powered dashboard.
## Master Rust and Cloud Development: Build Production-Ready Microservices with ShellCon
Looking to level up your Rust skills while learning modern cloud deployment? ShellCon offers a unique hands-on learning experience that combines Rust microservices development with Shuttle Cloud deployment. This comprehensive full-stack project will take you from local development to cloud deployment while solving real-world performance optimization problems.
### What is ShellCon?
ShellCon is an innovative learning approach that transforms Rust and cloud development education into a practical, project-based experience. Instead of working through abstract tutorials, you'll build and optimize a complete microservices architecture with three interconnected Rust services and a React dashboard.
#### Development Workflow
**Phase 1: Local Development** - Set up and run all three services locally, then verify the React dashboard connects properly to each service endpoint.
**Phase 2: Performance Optimization** - Solve four distinct performance challenges across the microservices, each focusing on different aspects of Rust optimization.
**Phase 3: Cloud Deployment** - Deploy your optimized services to Shuttle Cloud and validate everything works in a production environment.
### What You'll Build
You'll construct a complete microservices ecosystem consisting of three specialized Rust services working together through REST APIs. Your development journey involves three critical phases:
#### The Microservices Architecture
**aqua-monitor**: An environmental monitoring service that handles sensor data collection, tank readings, and system status endpoints. You'll work with async I/O patterns and HTTP client optimization.
**species-hub**: A database service managing species information, feeding schedules, and related data. This service teaches SQL optimization and efficient database interaction patterns.
**aqua-brain**: An analytics engine that processes data from the other services to generate insights and analysis. You'll focus on memory optimization and efficient string handling.
**React Dashboard**: A modern frontend that connects to all three services through REST APIs, providing real-time monitoring and control capabilities.
### What You'll Learn
ShellCon offers a comprehensive learning experience that combines project-based learning with real-world architecture. You'll build a complete application with production-like microservices while getting immediate feedback on your optimizations.
Through this hands-on approach, you'll learn:
- **Rust Development:** Async/await patterns, non-blocking I/O, SQLx with PostgreSQL, heap allocation optimization, and Axum connection pooling
- **Cloud Infrastructure:** Shuttle Cloud deployment, resilient microservices creation, Docker containers, and multi-stage deployment configuration
- **Frontend Integration:** Connecting React to Rust microservices, designing efficient RESTful endpoints, and implementing cross-service health checks
### Challenge Structure
Each challenge focuses on a specific aspect of Rust performance optimization:
#### Four Key Optimization Challenges
**1. Async I/O (aqua-monitor)**: Fix blocking operations in async code to improve tank readings performance.
**2. SQL Queries (species-hub)**: Optimize database queries to enhance species database efficiency.
**3. Memory Management (aqua-brain)**: Minimize heap allocations in the analytics engine using Rust's ownership system.
**4. HTTP Client Pooling (aqua-monitor)**: Implement connection reuse patterns to boost network performance.
## Getting Started is Simple
Ready to begin your Rust and cloud development journey? The setup process is straightforward:
1. **Clone the repository** and install prerequisites (Rust, Docker, Node.js, Shuttle CLI)
2. **Launch the three microservices** locally using the provided scripts
3. **Start the React dashboard** and verify all connections work
4. **Begin solving the four optimization challenges** at your own pace
5. **Deploy to Shuttle Cloud** and validate your solutions in production
### Start Your Rust Development Journey Today
The demand for Rust developers continues to grow as more companies adopt Rust for performance-critical applications. ShellCon provides the perfect combination of hands-on learning and real-world application that will prepare you for professional Rust development. Don't spend months reading documentation without building anything meaningful.
**Ready to build production-ready microservices and master Rust optimization?**
[Clone the repository](https://github.com/shuttle-hq/shuttle-shellcon.git) and start building:
```bash
git clone https://github.com/shuttle-hq/shuttle-shellcon.git
cd shuttle-shellcon
```
Your journey from Rust beginner to confident microservices developer starts with a single git clone. Start building today and master the skills that will define your backend development career!
---
_Join developers worldwide who are mastering Rust and cloud development through ShellCon's practical, project-based approach. Start building today and develop the microservices skills that will advance your backend development career._
---
# AI Assisted Rust Development Environment Setup: Build Rust APIs in Minutes
Source: https://www.shuttle.dev/blog/2025/07/03/rust-ai-workflow-guide
Date: 3 July 2025
Author: dcodes
Tags: rust, ai, mcp, cursor, shuttle
Learn how to build a complete Rust API with AI in 5 minutes using Cursor, MCP servers, and Shuttle.
Shipping Rust code used to mean wrestling with the borrow-checker, poring over docs, and SSH-ing into servers at 2 a.m. In 2025 that workflow feels prehistoric. With AI-first IDEs such as Cursor, tool-calling standards like [Model Context Protocol (MCP)](https://modelcontextprotocol.io/introduction), and one-command cloud hosts such as [Shuttle](https://www.shuttle.dev), you can spin up, test, and deploy a secure Rust API in 5 minutes before your coffee cools.
This guide shows you how to assemble an AI-assisted development environment tailored for Rust: code completion that understands your entire repo, agents that run migrations and push containers, and MCP plugins that read the latest docs instead of hallucinated snippets. We'll finish by launching a task-management API live to the cloud: hands-off coding, testing, and shipping in under five minutes using a true 10x developer workflow.
While this sounds cool, AI-assisted Rust development doesn't replace human developers. Treat it like a power tool: it boosts speed and efficiency, yet our craft still rests on understanding core programming concepts.
## What IDE Should You Use?
[Cursor](http://cursor.com/) is one of the most popular AI-powered code editors. Forked from VS Code, it keeps everything you love about VS Code while layering in AI-first features.
With Cursor, you tap into today's leading large-language models, and the built-in AI assistant writes code with full, context-aware knowledge of your entire codebase.
Features like **Codebase Indexing** can help the AI agents to search through your codebase with ease, and **Cursor Tab** will help you write code much faster and more efficiently by recommending code completions and edits that you can accept with just a tab press. You can think of it as an upgraded successor to what GitHub Copilot once was for AI-assisted development.
## Setting Up Your AI-Enhanced Development Environment
In this section, we'll explore how to build an AI-powered Rust development environment that handles everything from coding to cloud deployment. While we'll use Cursor as our main IDE, most techniques work with any AI coding tool, so don't worry if you're using different tools, be it **Windsurf**, **Claude Code**, or even a web based AI chatbot for rust api development.
We'll set up [MCP (Model Context Protocol) servers](https://modelcontextprotocol.io/introduction) that let AI assistants interact with external systems, explore Cursor's advanced features like codebase indexing and tab completion, and cover universal strategies for effective AI-assisted development. By the end, you'll have an environment where AI can autonomously write, test, and deploy your Rust applications with automated deployment rust workflows. **(YES! Even deployments!)**
### MCP Servers: Extending AI Capabilities
#### What Are MCP Servers?
LLMs excel at generating text, but their fixed knowledge cut-off means they often lack your project's freshest context. To bridge that gap, you need agents that can search databases, run shell commands, and pull live data from APIs. That's where MCP servers come in.
MCP servers are specialized tools that dramatically extend your AI assistant's capabilities beyond simple code generation. Think of MCP servers as powerful plugins that give your AI assistant the ability to interact with external systems, access real-time data, execute commands, and perform complex operations that would otherwise require manual intervention.
#### What MCP Servers Can Do for You
MCP servers transform your AI assistant from a simple code generator into a comprehensive development partner. Instead of just writing code, your AI can now:
- **Run database queries:** Fetch real time data from databases and use them to generate code or give you answers.
- **Perform searches** using search engines or searching documentations.
- **Execute system commands**
- **Interact with APIs** and external services.
- **Monitor application logs** and debug production issues.
- **Deploy applications directly** to cloud platforms like Shuttle.
MCP servers aren't confined to a single flavor: there's an ecosystem of ready-made options to choose from, and you can even build your own to run fully custom logic.
The screenshot below shows MCP servers in action. Notice how the AI assistant taps the specialized tool to deploy the Rust project to Shuttle.
In this example, you can see the AI assistant using the `deploy` tool to deploy the application to the cloud, demonstrating how MCP servers extend the AI's capabilities beyond simple code generation.
> Later in the article, we'll walk through how to use the Shuttle MCP server.
#### Recommended MCP Servers for Rust Development
Here are the essential MCP servers that will supercharge your Rust development workflow:
- [**Context7 MCP**](https://context7.dev/) - Context7 solves one of the biggest problems in AI-assisted development: outdated documentation. Instead of relying on generic or outdated information from LLM training data, Context7 pulls up-to-date, version-specific documentation and code examples directly from the source. This means your AI assistant gets accurate, relevant information about the exact versions of libraries you're using, eliminating hallucinations and providing working code examples.
- [**Shuttle MCP**](https://github.com/shuttle-hq/shuttle/tree/main/mcp) - Shuttle is a cloud platform specifically designed for Rust applications. This MCP server streamlines your entire deployment workflow, enabling seamless project creation, application deployment, environment management, and real-time monitoring directly within your development environment.
- [**Puppeteer MCP**](https://www.npmjs.com/package/@modelcontextprotocol/server-puppeteer) - A Model Context Protocol server that provides browser automation capabilities using Puppeteer. This server enables LLMs to interact with web pages, take screenshots, and execute JavaScript in a real browser environment.
- [**GitHub MCP**](https://github.com/github/github-mcp-server) - Integrates version control operations directly into your AI workflow. Manages code repositories, handles pull requests, tracks issues, and coordinates collaborative development without switching contexts.
- [**Playwright MCP**](https://github.com/microsoft/playwright-mcp) - Brings Microsoft's browser automation framework to your AI assistant. Enables cross-platform web testing across Chrome, Firefox, Safari, and Edge with enhanced reliability compared to traditional testing tools.
### Cursor Configuration
#### Enable Memories
Cursor provides a feature called **Memories**, this feature let's the AI agent to remember specific context about you and your project, using this feature for a while can make your AI agent more personalized and aware of your coding style, preferences and the projects you're working on.
To enable this feature, navigate to **Settings** > **Rules** > **Memories** and tick the **Generate memories** option.
#### Add Documentation Context
AI coding assistants are more powerful when they have a good understanding of the libraries and frameworks you're using, the more context, the better results you'll get. However, copy/pasting documentation in every chat is a tedious task and we don't wanna do that by hand.
Thankfully, Cursor provides us with a great developer friendly feature that allows us to add documentation context only once and we'll be able to use it as context in any chat we want.
To add documentation context:
Open the chat panel in Cursor and type `@Docs` in the chat.
Click "Add new doc".
Paste the URL prefix of the documentation you want to add (e.g., `https://docs.shuttle.dev`).
Press **Enter**, this will bring us to the last step, which we can specify a **title** for our documentation, along with an **entrypoint URL** and **prefix URL** for the documentation we want to add.
Cursor will automatically index the page and any sub-pages with that URL prefix. We can then mention it using `@Docs` and select the specific documentation we want to use. Claude 4.0 is especially good at this due to its large context window.
Cursor will automatically fetch the relevant documents and feed it to the AI assistant, we'll get an answer almost immediately, this saves us a lot of time and effort to search through documentation manually.
Recommended documentation to add:
- Rust standard library: `https://doc.rust-lang.org/std`
- Axum framework: `https://docs.rs/axum/latest/axum`
- SQLx: `https://docs.rs/sqlx/latest/sqlx`
- Shuttle: `https://docs.shuttle.dev`
This ensures the AI assistant understands the specific APIs, patterns, and best practices for our tech stack.
### Rust-Specific Rules for AI Agents
Rules are yet another AI feature provided by Cursor that allows us to define custom rules that guide how the AI writes code for our specific project.
Most developers skimp on documentation and pay for it later. **Cursor's Rules** feature flips that script: You drop a markdown file at `.cursor/rules/my-rule.mdc` into your repo, and the AI treats those notes as living docs. No more "I'll document it later" guilt 🙂 Your guidelines, style tips, and architectural clues are always in context, keeping the assistant (and your teammates) perfectly informed.
For that reason, we have **Cursor Rules**, Cursor allows us to define a set of custom rules that sets some rules for the AI agent to follow when writing code for a specific project.
Rules can be specified to projects, and they can be specified to be read automatically or manually.
Let's create a `.cursor/rules/rust.mdc` file in our project root with Rust-specific guidelines:
```bash
.
|-- .cursor
| |-- rules
| |-- rust.mdc
| |-- ...
|-- ...
```
```markdown
You are an expert Rust developer. Follow these rules when writing Rust code:
## Code Style
- Use idiomatic Rust patterns and conventions
- Prefer explicit error handling with Result
- Use ? operator for error propagation
- Implement proper ownership and borrowing
- Use descriptive variable names and function signatures
## Error Handling
- For comprehensive error handling, use libraries like `anyhow` for simple error handling, `thiserror` for custom error types, or `eyre` for enhanced error reporting
- Never use unwrap() or expect() in production code
- Provide meaningful error messages
- Use `anyhow::Result` for functions that can return multiple error types
- Use `thiserror::Error` derive macro for custom error enums
## Testing
- Write unit tests for all public functions
- Use descriptive test names that explain the scenario
- Group related tests in modules
```
> Important Note: These are generic rules for Rust development. You should customize these rules for your specific project. For example, if you're using a validation library like validator, write specific rules about how to handle validations. If you're using specific architectural patterns or frameworks, document them in your rules so the AI can follow your project's conventions consistently.
#### How Cursor Reads Your Specified Rules
Cursor will read these rules based on a few conditions that we can manually specify:
- **Always**: This will read the rules for every single chat we have with the AI assistant.
- **Auto Attached**: This will read the rules based on a specified glob pattern, for example, if we want the rules to be read for every rust file, we can specify the glob pattern to be `*/*.rs`. Or if we want to add rules for a specific crate, we can specify `crates/my_macros/**/*.rs`.
- **Agent Requested**: This gives us the option to add a description to the rules file, Cursor will automatically read these rules if it finds a description that matches the current chat.
- **Manual**: This will read the rules only when we manually mention it in the chat by typing `@Cursor Rules` and selecting the rules that we defined.
### Best Practices for AI Prompting
The general principle of **garbage in, garbage out** applies in prompt engineering as well, the more specific and detailed we are, the better the results we'll get.
Here are some best practices for AI prompting:
#### Use a Todo-Driven Approach
It's very common for the AI assistant to write some good code for a feature, only to delete, or modify it later and therefore breaking your code.
Instead of manually writing prompts each time, we can create a file for each task that we want to do, this file will contain all the tasks that have been done and that are pending for the specific feature that we want to build.
This way, our AI assistant will have a complete context and understanding of what we're trying to build and what we have done so far.
Create a `todo.md` file in your project root that explains your application requirements and features, then break them down into smaller, actionable tasks. Next time you want to work on a feature, you can just mention the `todo.md` file and the relevant file names that need to be changed and the AI assistant will work through the tasks systematically.
Here's an example:
```markdown
# Project: Task Management API
This API will be a simple task management API, it will have a few endpoints:
- GET /tasks - List all tasks with optional filtering
- POST /tasks - Create a new task
- GET /tasks/{id} - Get a specific task
- PUT /tasks/{id} - Update a task
- DELETE /tasks/{id} - Delete a task
## Requirements
- CRUD operations for tasks
- User authentication
- Database persistence
- REST API endpoints
## Tasks
### Project Setup
- [ ] Initialize Rust project with dependencies
- [ ] Set up database connection and migrations
### Authentication
- [ ] Create User struct and auth endpoints
- [ ] Implement JWT middleware and password hashing
### Task CRUD
- [ ] Create Task model
- [ ] Create the task CRUD endpoints
- [ ] GET /tasks - List all tasks with optional filtering
- [ ] POST /tasks - Create a new task
- [ ] GET /tasks/{id} - Get a specific task
- [ ] PUT /tasks/{id} - Update a task
- [ ] DELETE /tasks/{id} - Delete a task
- [ ] Add input validation and error handling for the task CRUD endpoints
### Testing
- [ ] Write unit and integration tests
- [ ] Set up test database
```
#### Provide Focused Context
Give the AI only the necessary context for the task at hand. Too much context can cause the AI to lose focus or forget important details. Be selective about which files and information you include.
#### Know When to Use MCP Servers vs CLIs
MCP servers and CLIs are both great tools that your AI agent can use to interact with systems, both of them have their pros and cons and you should know when to use each of them.
**When to use MCP servers:**
MCP servers can be superior to CLIs because the AI understands how to use them properly. While the AI might struggle with lesser-known CLI tools, MCP servers provide structured interfaces that the AI can navigate confidently. AI agents might not have the proper context for the CLIs and how to use them, therefore it has a more potential for hallucinations and making errors.
**When to use CLIs:**
If you're using a popular CLI tool like `git`, `docker`, `cargo`, etc. In that case, you won't need a MCP server for those actions, most LLMs have quite good knowledge on these tools and how they work.
Another reason to choose CLIs over MCP servers is that CLIs can stream their output and you don't need to wait for the processes to finish, you can see the code execution in real time, this streaming capability isn't available in MCP servers, on the contrary, you'll have to wait for the execution to finish before you can see the results.
#### Build Custom MCP Servers
If you already have an app or API, you can spin up a custom MCP server with the official SDKs, available in Rust and several other languages. A quick look at the docs shows just how straightforward the process is.
## Building a Complete Rust CRUD API with AI in 5 Minutes
Now for the exciting part—let's build and deploy a complete CRUD API using nothing but AI assistance. We'll use all the tools and techniques we've learned so far to build a task management API with full database integration using the Axum rust framework.
We'll also deploy the API to the cloud, we'll do all this without writing any code, we'll just let our AI assistant to do all the heavy lifting for us.
> Important Note
>
> This approach is not a complete replacement for human developers, AI can make mistakes and write code that is prone to bugs and security vulnerabilities. This demonstration is just a proof of concept and a way to show the power of AI-assisted development.
>
> When building production applications, make sure you review all the AI generated code and make sure it's secure, performant and reliable.
### Ready to Build Along?
To follow along with this tutorial, use our pre-configured template that includes all the necessary tools and configurations:
```bash
shuttle init --from shuttle-hq/shuttle-examples --subfolder axum/ai-assisted
```
This template includes pre-configured MCP servers, Cursor rules, and everything you need to follow along with the tutorial.
### Prerequisites
Before starting to code, there are a few tools that we need to install and configure.
- **Shuttle CLI**: To interact with shuttle using the CLI.
- **SQLx CLI**: To interact with the database using the CLI.
- **Shuttle MCP Server**: This is a MCP server that allows AI agents to look up the latest Shuttle documentation and gives proper context on how to interact with the Shuttle platform.
- **Docker**: To run a local database in a container.
#### Install the Shuttle CLI
Install the shuttle CLI, for Linux/macOS:
```bash
curl -sSfL https://www.shuttle.dev/install | bash
```
For Windows:
```powershell
iwr https://www.shuttle.dev/install-win | iex
```
#### Install the SQLx CLI
Install the SQLx CLI, for Postgres only:
```bash
# For postgres Only
cargo install sqlx-cli --no-default-features --features native-tls,postgres
```
### Setting Up MCP Servers
Before we start, let's set up a few MCP servers that are going to help us build and deploy our API much easier.
#### Shuttle MCP Server
The Shuttle MCP server enables AI agents to understand and execute Shuttle commands directly, including **deployments**, **fetching logs**, **searching through the latest Shuttle documentation** and **more**.
#### Configure Cursor for Shuttle MCP Server
Add the Shuttle MCP server to your Cursor configuration. On Linux/macOS, edit `~/.cursor/mcp.json`. On Windows, edit `%APPDATA%\\Cursor\\mcp.json`. Add the following to your MCP servers configuration:
```json
{
"mcpServers": {
"Shuttle": {
"command": "shuttle",
"args": ["mcp", "start"]
}
}
}
```
### Implementation Steps
#### Step 1: Project Initialization
First, we'll need to be logged in to the Shuttle CLI, you can do this by running:
```bash
shuttle login
```
This will redirect you to the Shuttle login page, and redirect you back to the terminal after you've logged in.
Next, let's create a new project for our task management API.
```bash
shuttle init
```
We just created a new project with the following options selected:
- **Project name**: `task-management-api`
- **Directory**: `~/Desktop/task-management-api`
- **Template and Framework**: A hello world template for **Axum**
- **Create a project on Shuttle**: Yes (this creates a new project on the Shuttle platform)
#### Step 2: Writing Tasks for AI Agents
For our AI assistant to understand our intention on what we're trying to build, we'll need to write a `todo.md` file that contains all the necessary tasks and requirements that we want to build.
Now, let's write down the tasks that we want to build:
```markdown
# Task Management API
This API will be a simple task management API, it will have a few endpoints, we'll use **Axum**, **Shuttle** and **SQLx** to build the API.
- GET /tasks - List all tasks with optional filtering
- POST /tasks - Create a new task
- GET /tasks/{id} - Get a specific task
- PUT /tasks/{id} - Update a task
- DELETE /tasks/{id} - Delete a task
## Tasks
- [ ] Install the dependencies
- [ ] Update the code to use a shared database using shuttle
- [ ] Create a migrations file for the tasks table
- [ ] Run the migrations
- [ ] Create the routes for the tasks endpoints
- [ ] Commit the changes
- [ ] Deploy the application to shuttle
- [ ] Write some tests for the production API
- [ ] Run the tests and fix the errors if any
```
#### Step 3: AI-Assisted Development
Let's tell Cursor to read the `todo.md` file and work through the tasks sequentially.
The todo list system is a great approach to give the AI agent a clear understanding of what we're trying to build, giving the AI agent a clear context of the details about the project.
The AI agent immediately ran the tool `search_docs` to search through the latest Shuttle documentation and find the relevant information needed for the the tasks.
The required migrations for the tasks have been created.
Once the tasks are complete, the AI agent will commit the changes listed in `todo.md` and deploy the application to Shuttle.
The AI agent then proceeds to the next step which is writing the tests to make sure the API is working as expected.
When running the tests, we can see that all the tests are failing:
The AI agent begins by debugging, gathering all the details it needs to fix the failing tests. It can also call the `deployment_status` and `logs` tools to inspect the latest deployment, scan the logs, and pinpoint the root cause.
These two tool calls provide the AI agent with everything it needs. After reviewing the results, it understands the issue and fixes the failing tests.
The issue was that `axum@0.8` changed its path parameter syntax from `/:id` to `/{id}` format.
The AI agent then proceeds to fix the tests and run them again:
Running the tests again:
Perfect, the tests are now passing, and the API is working as expected.
## The Power of AI Agents
What we just accomplished is remarkable - we built, deployed, and tested a complete API with a single prompt. The AI agent:
- Created database migrations
- Implemented CRUD endpoints
- Deployed to production
- Wrote comprehensive tests
- Debugged and fixed issues
- All autonomously
This represents a fundamental shift in how we approach software development. What traditionally took hours or days of manual work was completed in minutes through intelligent automation.
Before we celebrate, remember: AI-generated code is far from infallible. The automation is impressive, but it introduces real risks that demand our attention.
## Precautions and Security Risks
AI-assisted development can supercharge productivity, yet it also opens new security fronts developers can't afford to ignore.
### Critical Security Awareness
AI-generated code can contain security vulnerabilities and implementation flaws that may not be immediately obvious. **AI can be confidently wrong** about security implementations, error handling, business logic, etc.
**Never blindly trust AI-generated code.** What appears correct at first glance may hide subtle, critical security flaws, or overlook key scalability and performance implications.
### Dependency Security Risks
- AI may suggest outdated or unmaintained packages
- Dependencies with known vulnerabilities
- Packages from untrusted sources
- Excessive permissions or unnecessary dependencies
## Best Practices for AI-Assisted Development
The key to successful AI-assisted development is reviewing every bit of code that the AI agent writes.
### Mandatory Code Review Process
**ALWAYS review AI-generated code before accepting it.** This is non-negotiable for production applications.
### Testing AI-Generated Code
- **Write additional tests** beyond what AI generates
- **Focus on edge cases** and error conditions
- **Test security boundaries** with invalid inputs
- **Perform integration testing** with real data
- **Load test** critical endpoints
> Remember: AI may speed up development, but it doesn't guarantee secure or reliable code. It's up to you to review each change and ensure everything is secure, performant, and dependable.
## Conclusion
Just a few years ago, Rust was notorious for its steep learning curve. The borrow-checker barked at nearly every line. Today, AI-powered editors like Cursor, paired with deploy-anywhere platforms such as Shuttle, make writing and shipping a Rust API almost effortless.
This is what a ridiculously productive workflow looks like. We spun up a complete Rust CRUD API from scratch, shipped it, debugged it, and even hammered the production deployment with tests. And it only took us a few minutes! This isn't a dream, it's just the reality of building with AI agents on Shuttle.
It's also important to note that while AI can be extremely helpful in accelerating development time, it's still subject to making mistakes and leaving security vulnerabilities in your code. It is always best practice to review the code and ensure you are only committing high-quality, secure, and performant code.
Develop the mentality of treating AI as a tool, not a replacement for human developers, this way you'll get work done much faster and much more efficiently without exposing your code to security vulnerabilities.
**Don't just build. Create at the speed of thought**
Ready to experience a true 10x developer workflow? Our AI-assisted Rust template is your launchpad into the future of software development. See what you can create when AI is your copilot:
```bash
shuttle init --from shuttle-hq/shuttle-examples --subfolder axum/ai-assisted
```
---
# The Hidden Costs of Deploying Rust Microservices
Source: https://www.shuttle.dev/blog/2025/06/18/rust-microservices-deployment-costs
Date: 18 June 2025
Author: dcodes
Tags: rust microservices, rust async, rust sqlx, axum framework, devops best practices
Discover the hidden costs of microservices deployment at scale. Learn practical solutions to infrastructure complexity with Rust and Shuttle examples.
Microservices promise speed, scale, and team autonomy. But once you deploy more than a handful, the complexity creeps in. Teams suddenly face config sprawl, CI duplication, secret management, and fractured environments.
In this article, we'll explore the hidden operational costs of microservices, especially for Rust developers. You'll see how Shuttle's dev-first approach simplifies the provisioning and deployment journey, and we'll even give you a real microservices challenge to try yourself.
We'll end the blog post with a special challenge for Rust developers for building Rust microservices at scale with ease. The challenge is designed to be fun and at the same time demonstrate microservice provisioning and deploying multiple microservices while using best practices.
## Monolith vs Microservices
### What is a monolith?
Modern applications often evolve from monoliths to microservices, and for good reason.
A **monolith** is a single, tightly coupled codebase running as one process. It's simple to start but becomes harder to scale as teams and features grow. Every small change risks affecting the entire system.
**Microservices**, by contrast, are small, independently deployable services. They offer:
- **Faster development:** Teams can ship features without waiting on others.
- **Scalable infrastructure**: Only the services that need more resources get scaled.
- **Tech flexibility**: Use Rust for performance-critical services, and Python or Go where it fits.
- **Resilience**: One service can fail without taking the whole app down.
- **Team autonomy**: Squads own, deploy, and monitor their own services.
- **Cost-effective scaling**: Scale only the services that need resources, not the entire application stack.
_Example: A Netflix clone might break into services like Recommendations, Streaming, Billing, and Users. With a monolith, they share the same release cycle. With microservices, each evolves and scales independently._
Microservices give you the ability to scale only the services that need the additional resources.
But while microservices sound ideal, they introduce operational complexity, especially as your system grows.
## Hidden Costs of Deploying Rust Microservices
While these benefits are compelling, microservices aren't without challenges. Behind these benefits are unexpected problems that can slow you down, add extra work, and confuse your team. Managing and deploying many small services often gets messy, takes more time, and brings surprises you did not plan for.
Infrastructure management quickly becomes complex with configuration files, CI/CD pipelines, and service dependencies. The theoretical advantages of independent deployments and technology flexibility become overshadowed by infrastructure demands.
### Common pitfalls of microservices
Let's dive into some of the common pitfalls of microservices. By the end of this blog post, we'll have a good understanding of the challenges and we'll talk about **tools that can help us overcome these challenges**.
### Infrastructure as Code Complexity
Managing infrastructure with tools like **Terraform** becomes challenging when scaling to dozens of configuration files across multiple environments. Each service requires its own configuration files for networking, security, compute resources, and storage.
### CI/CD Pipeline Proliferation
Each microservice typically requires its own CI/CD pipeline, leading to increased maintenance overhead. Teams must dedicate resources to maintaining build configurations across numerous services.
### Observability Challenges
Implementing a well set up monitoring system requires integrating **logging**, **metrics**, and **tracing** across all services. Organizations frequently end up with disconnected monitoring tools, making incident investigation difficult when problems occur.
### Domains and Certificate Management
Managing domains and SSL certificates across multiple microservices creates significant operational overhead. Each service and environment typically requires its own subdomain (**api.company.com**, **auth.company.com**, **payments.company.com**), and each subdomain needs SSL certificates for secure communication. They also need to be renewed periodically. Without proper tooling, this becomes extremely difficult to manage, with surprises of expired certificates.
### Environment Management Complexity
Microservices multiply environment management challenges. Where a monolith might have three environments (**development**, **staging**, **production**), microservices often require environment parity across dozens of services.
Each service needs its own environment-specific configurations, database connections, and service discovery settings. Maintaining consistency across environments becomes extremely difficult when services have different deployment schedules and dependency requirements.
### Database Proliferation and Management
Each microservice typically requires its own database to maintain data isolation and independence. This database-per-service pattern creates operational complexity that teams often underestimate.
Database provisioning, backup strategies, monitoring, and maintenance must be replicated across dozens of database instances. Each database needs its own connection pooling, and performance tuning.
### Secrets and Configuration
The more services you have, the more secrets and configurations you need to manage. Without proper tooling for managing secrets and configurations, this becomes extremely difficult to manage.
## How Microservices Are Typically Deployed
In conventional microservices architectures, each service typically requires its own microservice deployment pipeline and infrastructure configuration. Let's examine what this traditionally looks like and understand the complexity involved.
### Docker and Container Management
Most microservice deployments start with Docker. Each service needs its own `Dockerfile` and typically a `docker-compose.yml` file for local development. Here's an example of what a traditional setup might look like:
```yaml
# docker-compose.yml
version: "3.8"
services:
blog-api:
build: ./blog-service
ports:
- "3001:3000"
environment:
- DATABASE_URL=postgresql://user:password@postgres:5432/blog_db
- ANALYTICS_SERVICE_URL=http://analytics-service:3000
- ANALYTICS_API_KEY=your-super-secret-api-key-here
depends_on:
- postgres
- analytics-service
analytics-service:
build: ./analytics-service
ports:
- "3002:3000"
environment:
- DATABASE_URL=postgresql://user:password@postgres:5432/analytics_db
- ANALYTICS_API_KEY=your-super-secret-api-key-here
depends_on:
- postgres
postgres:
image: postgres:15
environment:
- POSTGRES_USER=user
- POSTGRES_PASSWORD=password
- POSTGRES_DB=blog_db
volumes:
- postgres_data:/var/lib/postgresql/data
ports:
- "5432:5432"
volumes:
postgres_data:
```
Each service will have its own `Dockerfile` as well. Managing these needs careful attention - you'll need to make sure that the services are compatible with each other, and that the services are compatible with the infrastructure you're using.
This is for a simple setup, however, when it comes to production environments with high traffic, you'll need multi node deployments and things get complex quickly, and you'll need to manage a lot of additional complexity:
- Kubernetes manifests
- Load balancer configurations with SSL termination
- Service meshes like Istio
- Auto-scaling groups
- Network security
- Database clusters
The list goes on, and the complexity increases.
Secret management also becomes extremely complex with rotation strategies, encrypted storage systems like Vault, access control policies, and certificate management across all environments.
You'll also need comprehensive monitoring and observability, once you have multiple containers across multiple nodes, this becomes extremely difficult to manage.
This traditional approach, while powerful and battle-tested, creates significant operational overhead where teams often spend most of their time managing infrastructure, Kubernetes configurations, and deployment pipelines instead of building features.
## Simplify Rust Microservice Deployment with Shuttle
Luckily, we're not going to have to do all of that. With **Shuttle**, we can focus on building our application logic instead of wrestling with infrastructure complexity. Shuttle handles microservice provisioning, secret management, and deployment orchestration automatically, letting us deploy production-ready Rust microservices with just a few commands.
### Introducing a Developer-First Approach to Infrastructure
Instead of managing infrastructure separately, we can manage it directly in our application code, using the same tools and languages we already know.
**Shuttle** embodies this approach by removing the complexity of managing infrastructure and deployment. Rather than dealing with Terraform or cloud consoles, you define resources like **databases and secrets** using straightforward Rust attributes.
In this tutorial, we'll build multiple interconnected Rust microservices with **Axum** and then deploy them to the cloud with **Shuttle**. We'll create a **Blog API service** and an **Analytics service** that communicate with each other, demonstrating true microservices architecture with service-to-service communication.
### Building Multiple Microservices with Shuttle
For this example, we'll build two interconnected services:
1. **Analytics Service** - Tracks and processes blog post views and interactions
2. **Blog API Service** - Manages blog posts and sends analytics events
Let's start by installing the **Shuttle CLI**:
### Linux and macOS
```bash
curl -sSfL https://www.shuttle.dev/install | bash
```
### Windows (PowerShell)
```bash
iwr https://www.shuttle.dev/install-win | iex
```
Login to the **Shuttle CLI**:
```bash
shuttle login
```
### Install the sqlx-cli
To be able to use `sqlx` and interact with the database, we'll need to install the `sqlx-cli` tool. This particular command sets it up for postgres only.
```bash
# Install sqlx-cli (if not already installed)
cargo install sqlx-cli --no-default-features --features native-tls,postgres
```
### Source Code
The complete source code for the microservices we'll build is available on GitHub: [Shuttle Microservices Demo](https://github.com/dcodesdev/shuttle-microservice-demo) You can clone the repository to follow along or reference the final implementation.
### Creating the Analytics Service
Create the first project for our analytics service:
```bash
shuttle init --template axum
```
Add dependencies for the analytics service:
```bash
cargo add shuttle-shared-db serde sqlx serde_json \
--features shuttle-shared-db/postgres,shuttle-shared-db/sqlx \
--features serde/derive
```
To use `sqlx` properly to interact with the database, we'll need to set up a local database and set the `DATABASE_URL` environment variable in the `.env` file.
To create a database, the easiest way to do it is by using Docker, you'll need to have docker installed on your machine, if you haven't already, make sure you [install it here](https://docs.docker.com/get-docker/) for your specific operating system.
Once you have docker installed, you can run the following command to create a database:
```bash
docker run -d --name postgres --restart=always -e POSTGRES_USER=postgres -e POSTGRES_PASSWORD=password -p 5432:5432 postgres
```
Once your database is ready to accept connections, you can set up the analytics database:
Make sure you add `.env` to your `.gitignore` file.
```bash
echo ".env" >> .gitignore
```
Update the migration file:
```sql
-- migrations/_create_events.sql
CREATE TABLE events (
id SERIAL PRIMARY KEY,
event_type VARCHAR NOT NULL,
post_id INTEGER,
data JSONB,
created_at TIMESTAMP DEFAULT NOW()
);
```
Run the migration:
```bash
cargo sqlx migrate run
```
### Securing service communication
In order to secure the communication between the analytics service and the blog service, we'll need a way to verify the identity of the requester. To do that, we'll have a **secret key** that only the two services know about. If the requester has the correct secret key, the request will be allowed to proceed, otherwise it will be rejected.
### Secret management with Shuttle
The **secret key** must be kept secret, therefore it **must not** be committed to version control and must be handled securely using proper tooling. For that, Shuttle provides us a way to define secrets in a secure manner, by giving us a macro that we can use directly in our application code. To define the secrets, **Shuttle** expects a `Secrets.toml` file in the root of the project.
The `Secrets.toml` file is a simple configuration file that contains the secrets for the project. It's a **TOML** file, which is a simple configuration file format that is easy to read and write.
Create the `Secrets.toml` file:
```toml
# Secrets.toml
ANALYTICS_API_KEY = "your-super-secret-api-key-here"
```
We can use the `ANALYTICS_API_KEY` secret in the code with the `#[shuttle_runtime::Secrets]` macro:
```rust
#[shuttle_runtime::main]
async fn main( #[shuttle_runtime::Secrets] secrets: SecretStore) -> shuttle_axum::ShuttleAxum {
let api_key = secrets.get("ANALYTICS_API_KEY").expect("ANALYTICS_API_KEY must be set");
// Use the api_key anywhere in your code...
Ok(router.into())
}
```
### Database provisioning with Shuttle
Shuttle provides an easy way to provision databases, just by adding a macro to your `main.rs` file, you'll have a database set up and connected to after you deploy to Shuttle.
```rust
#[shuttle_runtime::main]
async fn main(
#[shuttle_shared_db::Postgres] pool: PgPool,
) -> shuttle_axum::ShuttleAxum {
...
}
```
To make development easier, you can set your own `local_uri` to connect to your local database.
```rust
#[shuttle_runtime::main]
async fn main(
#[shuttle_shared_db::Postgres(
local_uri = "postgres://postgres:password@localhost:5432/analytics_db"
)] pool: PgPool,
) -> shuttle_axum::ShuttleAxum {
...
}
```
Now, let's implement the routes for the service, we'll have two routes, one for receiving events and one for getting statistics.
For the full version of the code, see the [GitHub repository here](https://github.com/dcodesdev/shuttle-microservice-demo).
```rust
async fn receive_event(
State(state): State,
Json(event): Json,
) -> StatusCode {
let result = sqlx::query!(
"INSERT INTO events (event_type, post_id, data) VALUES ($1, $2, $3)",
event.event_type,
event.post_id,
event.data
)
.execute(&state.db)
.await;
match result {
Ok(_) => StatusCode::CREATED,
Err(_) => StatusCode::INTERNAL_SERVER_ERROR,
}
}
async fn get_stats(State(state): State) -> Json> {
let stats = sqlx::query_as!(
EventStats,
"SELECT event_type, COUNT(*) as count FROM events GROUP BY event_type"
)
.fetch_all(&state.db)
.await
.unwrap_or_default();
Json(stats)
}
```
Having a look at this snippet in the code:
```rust
#[shuttle_runtime::main]
async fn main(
#[shuttle_shared_db::Postgres(
local_uri = "postgres://postgres:password@localhost:5432/analytics_db"
)] pool: PgPool,
#[shuttle_runtime::Secrets] secrets: SecretStore,
) -> shuttle_axum::ShuttleAxum {
...
}
```
Connecting to a database using Shuttle is as simple as adding a macro to your `main.rs` file. This macro will automatically provision a database for you. The `local_uri` is used to connect to your local database for development purposes.
For managing secrets, we have used the `#[shuttle_runtime::Secrets]` attribute provided by Shuttle that will automatically load the secrets from the `Secrets.toml`. Shuttle will automatically push the secrets to the cloud in a secure manner when running `shuttle deploy`.
Let's build a middleware function to authenticate requests using the `ANALYTICS_API_KEY` from the `Secrets.toml` file. This way, only our blog service can send analytics events to the analytics service.
```rust
async fn auth_middleware(
headers: HeaderMap,
State(state): State,
request: axum::extract::Request,
next: axum::middleware::Next,
) -> Result {
let auth_header = headers
.get("Authorization")
.and_then(|header| header.to_str().ok())
.and_then(|header| header.strip_prefix("Bearer "));
match auth_header {
Some(token) if token == state.api_key => Ok(next.run(request).await),
_ => Err(StatusCode::UNAUTHORIZED),
}
}
```
### Deploying the Analytics Service
Before we deploy the service, we'll need to follow another step that is specific to [sqlx](https://github.com/launchbadge/sqlx/), we'll need to prepare the SQL queries for production so that the code can compile without the need for an active database connection, you can read more about [how sqlx works here](https://github.com/launchbadge/sqlx/).
### Prepare the SQL queries for production
```bash
cargo sqlx prepare
```
Make sure you commit the generated metadata by SQLx.
```bash
# Commit the generated metadata by SQLx
git add .
git commit -m "Prepare SQL queries for production"
```
### Deploy the service
Deploying services with **Shuttle** is as simple as running `shuttle deploy` in the root of the project.
```bash
shuttle deploy
```
This will deploy the service to the cloud, you'll see the deployed URL in the console, we'll use this URL in our blog service to send analytics events to the analytics service.
### Creating the Blog API Service
Now let's create our blog service that will depend on the analytics service:
```bash
shuttle init --template axum
```
Add the required dependencies for our blog service:
```bash
cargo add shuttle-shared-db serde reqwest tokio sqlx serde_json \
--features shuttle-shared-db/postgres,shuttle-shared-db/sqlx \
--features serde/derive \
--features reqwest/json \
--features tokio/full
```
Set up the database environment:
```bash
# Create .env file for local development
echo "DATABASE_URL=postgres://postgres:password@localhost:5432/blog_db" > .env
# Create the database
cargo sqlx database create
# Create migration
cargo sqlx migrate add create_posts
```
Add `.env` to your `.gitignore` file.
```bash
echo ".env" >> .gitignore
```
Update the migration file:
```sql
-- migrations/_create_posts.sql
CREATE TABLE posts (
id SERIAL PRIMARY KEY,
title VARCHAR NOT NULL,
content TEXT NOT NULL,
created_at TIMESTAMP DEFAULT NOW()
);
```
Run the migration:
```bash
cargo sqlx migrate run
```
Create a `Secrets.toml` file for configuration:
```toml
# Secrets.toml
ANALYTICS_SERVICE_URL = "https://analytics-service-m7iz.shuttle.app" # Replace with your analytics service URL
ANALYTICS_API_KEY = "your-super-secret-api-key-here"
```
Now let's implement our blog service with analytics tracking. We're going to implement a few routes: Create a post, get a post and get a list of all posts. See the [source code here](https://github.com/dcodesdev/shuttle-microservice-demo).
```rust
async fn create_post(
State(state): State,
Json(payload): Json,
) -> Result, StatusCode> {
...
}
async fn get_posts(State(state): State) -> Json> {
...
}
async fn get_post(
Path(id): Path,
State(state): State,
) -> Result, StatusCode> {
...
}
```
### Service to service secure communication
To send events to the analytics services, we'll need to create a new function to send analytics events to the analytics service, this function is used to communicate with the analytics service using secure `HTTP` requests.
```rust
async fn send_analytics_event(state: &AppState, event: AnalyticsEvent) -> Result<(), reqwest::Error> {
let client = reqwest::Client::new();
let _response = client
.post(&format!("{}/events", state.analytics_url))
.header("Authorization", format!("Bearer {}", state.analytics_api_key))
.json(&event)
.send()
.await?;
Ok(())
}
```
We have used the `ANALYTICS_SERVICE_URL` and `ANALYTICS_API_KEY` from the `Secrets.toml` file to send the analytics event to the analytics service. This way both services are independent of each other, they have their own databases and can be deployed independently.
To make this communication secure, we have used the `ANALYTICS_API_KEY` to authenticate the request to the analytics service.
### Deploy the blog service
The process is similar to the analytics service, we'll need to prepare the SQL queries for production and deploy the service.
```bash
cargo sqlx prepare
```
Commit the generated metadata by SQLx.
```bash
git add .
git commit -m "Prepare SQL queries for production"
```
Deploy the service using **Shuttle**:
```bash
shuttle deploy
```
🎉 Great! Now both of our services are deployed and ready to use.
### Testing the services
Let's test the services and make sure they're working as expected:
```bash
# Create a blog post (this will trigger an analytics event)
curl -X POST https://blog-service-3hhs.shuttle.app/posts \
-H "Content-Type: application/json" \
-d '{"title": "My First Post", "content": "Hello microservices!"}'
# Response
{"id":1,"title":"My First Post","content":"Hello microservices!"}
# View the post (this will trigger another analytics event)
curl https://blog-service-3hhs.shuttle.app/posts/1
# Response
{"id":1,"title":"My First Post","content":"Hello microservices!"}
# Check analytics stats
curl -s https://analytics-service-m7iz.shuttle.app/stats | jq
[
{
"event_type": "post_viewed",
"count": 2
},
{
"event_type": "post_created",
"count": 1
}
]
```
Great! Our services are working as expected, we have a blog service that can create and view posts, and an analytics service that can track analytics events.
### Traditional vs Shuttle: Microservice Deployment Complexity Comparison
Comparing this approach with the traditional approach, we can see that we no longer need to manage multiple configuration files and orchestration tools - we can focus on building our application logic instead. With this approach, teams can focus on building smaller Rust microservices without worrying about the infrastructure, secrets management, and observability tools. This makes microservice deployment much faster and easier.
| Aspect | Traditional Setup (Docker/Kubernetes/Terraform) | Shuttle Setup |
| ----------------------------- | ------------------------------------------------------------------------------------------------------ | --------------------------------------------------------------------------- |
| **Infrastructure Management** | Manual configuration of Dockerfiles, docker-compose.yml, Kubernetes manifests, and Terraform files | Automated infrastructure provisioning through Shuttle |
| **Database Provisioning** | Manual setup of PostgreSQL containers, volumes, and Terraform database resources | Automatic database provisioning with Shuttle's shared database feature |
| **Secret Management** | Environment variables in docker-compose.yml, Kubernetes secrets, or external tools like Vault | Integrated secret management using Shuttle's Secrets.toml |
| **Deployment Complexity** | Requires manual deployment steps, CI/CD pipeline configuration, and Kubernetes/Terraform orchestration | Simple deployment with `shuttle deploy` command |
| **Scalability** | Manual configuration of Kubernetes HPA, scaling policies, and load balancers | Built-in scalability features with Shuttle |
| **Monitoring** | Requires additional monitoring tools, Prometheus setup, and configuration | Integrated monitoring capabilities with Shuttle |
| **Development Experience** | Complex setup for local development with Docker, minikube, or kind clusters | Simplified development experience with Shuttle's local development features |
## Conclusion
Microservices provide a variety of benefits - isolating different parts of your application makes deployment easier, enhances security and scalability. This way you can scale only the services that need the additional resources.
However, this doesn't come without a cost. Adding more microservices means more complexity and infrastructure management, which makes development slower and more difficult.
Using **Shuttle** can make microservice deployment easier. Without having to deal with the complexity of managing infrastructure, you can focus on building your application. You no longer have to worry about microservice provisioning, managing secrets, or managing your CI/CD pipeline. Learn more about [building Rust web applications with Shuttle](https://docs.shuttle.dev/getting-started/quick-start).
This makes development easier and much faster, putting you ahead of the curve. You can focus on **shipping** rather than **managing infrastructure**.
## Frequently Asked Questions
---
# Process Beats Perfection: Observability Best Practices
Source: https://www.shuttle.dev/blog/2025/06/10/observability-best-practices
Date: 10 June 2025
Author: shaaz
Tags: observability, best-practices, devops, resilience
Observability best practices prove process beats perfection. Learn how disciplined iteration builds resilient systems that scale with confidence.
# Process Beats Perfection: Why Observability Enables Building Resilient & Scalable Systems
If you've ever been in a system design whiteboarding interview where you're asked to design a scalable and highly available web service, you'll know the rabbit hole it can become. You draw a box, label it "web server," and suddenly you're cascading into a never-ending list of concerns—load balancing, database replication, regional failovers, backpressure mechanisms, retries, caching, circuit breakers. As a fresh grad, I remember thinking, _is this just an infinite loop of optimization? When do I know I've done enough?_
## The Power of Process Over Perfection
But of course, life is simpler than that. We don't have to build perfect systems upfront. In fact, trying to do so usually leads to unnecessary complexity and wasted effort.
The secret to building highly available, scalable systems isn't prescience—it's process. The most resilient systems out there didn't start perfect; they became robust through consistent iteration, guided by excellent observability and a disciplined feedback loop.
**That's where good service observability comes in**. It's the foundation that lets us see where things are cracking before they shatter. With tools like dashboards, traces, metrics, and logs, we can identify real-world issues as they emerge in production, prioritize based on impact, and fix them incrementally. Add a strong operational cadence—like a weekly review of key dashboards—and suddenly you're not chasing stability reactively, you're engineering it proactively.
[Shuttle's new Monitoring & Observability integration with BetterStack](https://docs.shuttle.dev/docs/telemetry/betterstack) solves the long-standing pain of setting up observability. With just a few clicks, it's built into your deploys from the start. BetterStack was chosen as one of our first integrations for its simplicity and generous free tier. Want resource usage metrics? Just create a BetterStack source, update the config in the Shuttle console, redeploy your project and you should be able to graph CPU, Memory and Network metrics on a dashboard quickly.
## Observability Foundations: The Three Pillars of Metrics
We build robust systems not by guessing where the next problem will strike, but by instrumenting our systems well and following signals. The [AWS Builder's Library offers a compelling model for observability](https://aws.amazon.com/builders-library/building-dashboards-for-operational-visibility/) by categorizing metrics into three main types:
1. **Customer or client metrics**
2. **Resource metrics**
3. **Diagnostic metrics**
Each of these plays a unique role in guiding operational excellence and scaling systems over time.
### Customer Metrics - Alert from the Spout
Customer metrics are the heartbeat of any service. They tell you how real users are experiencing the system. Hyperscalers and market-leading cloud platforms practice what [Rob Ewaschuk at Google called "alerting from the spout"](https://docs.google.com/document/d/199PqyG3UsyXlwieHaqbGiWVa8eMWi8zzAn0YfcApr8Q/edit?tab=t.0#heading=h.fs3knmjt7fjy)—that is, monitoring what the client sees, not just what the server thinks it's doing.
**Why?** Because symptoms surface where the user sits. Alerting from the _outside in_—using external uptime monitoring with a probe, like the uptime feature BetterStack offers—means you catch broad classes of issues early, from timeouts to bad dependencies. Guessing root causes from low-level server metrics is like diagnosing illness by checking your pulse—you might catch something, but you're probably missing the bigger picture.
To stay focused on what matters, Google's Site Reliability Engineering (SRE) book recommends measuring **the Four Golden Signals**:
- **Latency**: How long does it take to process a request?
- **Traffic**: How much demand is hitting your service?
- **Errors**: What fraction of requests are failing?
- **Saturation**: How "full" is your system—are you nearing limits?
So build dashboards that clearly display latencies, error rates, and success ratios measured at the edge of your system closest to your clients, and review them weekly. That review loop gives you structured opportunities to detect regressions, catch drift, and hold yourself accountable to real user experience.
The good news? Tracking these signals in a Shuttle service is straightforward—you can use the Rust **tracing** framework to emit metrics directly from your API handlers. With macros like **#[instrument]** and libraries such as **axum-tracing-opentelemetry**, which integrate OpenTelemetry with the Axum web framework, you can automatically capture spans and metrics tied closely to your code. And soon, Shuttle will offer built-in abstractions to expose an opinionated set of standard metrics out of the box, with no manual instrumentation needed.
### Resource Metrics - Know What You're Burning
Resource metrics give us a peek under the hood. In classic systems terms, computers are fundamentally about compute, memory, and I/O. Your service is no different. CPU starvation, memory pressure, network congestion, or slow disks—all of these are common culprits behind degraded performance.
You don't need to over-optimize upfront. But if your system is slow and client metrics say "something's wrong," resource metrics can often tell you _what_. When troubleshooting, check these next: is the CPU utilization excessively high? Is network bandwidth being throttled? Are out of memory errors causing your project to restart?
[BetterStack dashboards via Shuttle's integration](https://www.shuttle.dev/blog/2025/02/19/using-shuttle-with-betterstack) surface these metrics at the instance or container level with a few clicks and a redeployment—because you can't scale if you don't know what you're exhausting.
### Diagnostic Metrics - Follow the Dependencies
Diagnostic metrics complete the picture by connecting symptoms to potential causes. These often live in the messy web of service-to-service dependencies: databases, caches, auth services, third-party APIs. Anything your project talks to over a network can—and eventually will—fail.
So, track these dependencies explicitly. [AWS emphasizes building **dependency dashboards** that show how your downstream services are behaving _from your service's perspective_](https://aws.amazon.com/builders-library/building-dashboards-for-operational-visibility/). If your success rates are dropping, and client metrics look red, check these dashboards: did your database start timing out? Is a rate limit being hit upstream? The more clearly you track these relationships, the faster you can isolate and fix failures.
## A Real-World Debugging Walkthrough
### Step 1 - Start with the Client Metrics
Let's bring this to life with a classic troubleshooting exercise. Imagine you've committed to being oncall for a friend's side project, and your friend texts you from vacation: _"Hey, my little home project is down, can you check on it?"_ It's a simple cloud infrastructure setup—a public user-facing API service talking to another backend service, which connects to a database.
You start where you always should: the **client metrics dashboard**. This is your spout. You want to know what users are seeing. The graph tells you: there's a sudden spike in HTTP 500 responses. Latency is up, and request success rates have dipped sharply. OK—there's definitely a real problem.
Now you start tracing the path of a request through the system, one hop at a time.
### Step 2 - Trace Through Services
First, you move to the **user-facing API service** **metrics**. Are these 500s being generated by the public API endpoints of your service itself, or is it just passing along errors from a downstream service? You look at the status code breakdown from the frontend logs. Yup—these 500s are coming from upstream. Your user-facing API is mostly healthy; it's a dependency that's the issue. That rules out the public API logic or static asset serving as the issue.
Next stop: the **backend service's API metrics**. You check its logs and diagnostic dashboards. It's returning 500s internally, and now you dig deeper—what's triggering those errors? You see timeout exceptions when the backend tries to query the database. That's your first clue pointing to a failing dependency.
### Step 3 - Isolate the Root Cause
Now you move to **diagnostic and resource metrics** for the database. This is where good dependency dashboarding pays off. The database connection errors started right when the client errors did. You check the metrics for the RDS instance: CPU and memory look fine, but the DB is reporting elevated I/O wait times. Maybe it hit some capacity threshold.
### Step 4 - Deploy, Rollback, Verify
At this point, you've traced the issue from symptom to source:
1. Clients are seeing 500s
2. Public API service is relaying 500s from backend
3. Backend service is failing on DB timeouts
4. Database is overloaded
You notice the timestamp at which the DB load started spiking, and try to correlate it to a previous deployment. Sure, you could try to root cause the real issue, but now that you've triaged the issue, you want to attempt a quick mitigation before a true root cause.
So, you check if subsequent changes after the problematic deployment are safe to rollback, and redeploy your project to last known good commit via the Shuttle Console. Then, you watch the dashboards. Backend errors stop. Public API metrics normalize. Client success rate recovers on your uptime probe.
This is observability at work—**a structured, top-down root cause workflow**. You didn't guess. You followed the request. And you ruled out each dependency one at a time, which is exactly what great operational visibility enables.
## Make It a Habit, Not a Hero Move
This isn't magic. It's a process. And the best teams make it a habit: review dashboards weekly, tune alerts thoughtfully, and build visibility from the top down.
There's another core process that's critical for iterative scaling and reliability: learning from incidents using postmortems that are made rigorous and scientific by enhanced observability. We'll discuss that in a later article.
With Shuttle, you get the ability to deploy fast _and_ observe well, which means you can keep building, scaling, and debugging incrementally—without needing a crystal ball to foresee every failure. That's how high availability becomes a living system, not a paper exercise.
## So... Now What?
Sure, you could keep hand-rolling dashboards in your staging-only observability graveyard—or you could try something less painful.
With [Shuttle's BetterStack + OpenTelemetry integration](https://docs.shuttle.dev/docs/telemetry/getting-started), your service ships **with real metrics out of the box**—no bash scripts, no dashboards lost in tabs, no "I'll do it later" promises to your future self.
Just:
- [Enable your OTEL exporter in your shuttle runtime](https://docs.shuttle.dev/docs/telemetry/getting-started)
- [Add a source in BetterStack](https://docs.shuttle.dev/docs/telemetry/betterstack)
- Update your Shuttle project config in console
- Redeploy from CLI
- Watch those golden signals light up
📈 Observability: now as easy as shipping code.
🎯 [Get started with real metrics →](https://docs.shuttle.dev/docs/telemetry/getting-started)
---
---
# Troubleshooting Rust Web Applications
Source: https://www.shuttle.dev/blog/2025/04/29/troubleshooting-rust-web-applications
Date: 29 April 2025
Author: dcodes
Tags: rust, web, debugging, monitoring, tracing, logging
A guide to troubleshooting Rust web applications
## Introduction
Rust can save you from a lot of programming pitfalls that other languages can't, but it's not immune to bugs and issues, there are
situations that you'll need to follow best practices and use the right tools to troubleshoot your application.
Bugs are inevitable, but we can make them easier to find and fix. In this guide, we'll explore how to troubleshoot Rust applications using a
variety of approaches and tools.
## Structured Logging
For backend services, logging is crucial for getting and idea how your application is performing and what's happening behind the scenes.
However, there are better ways to log than just using a simple `println!`.
Without visibility into your application's behavior, debugging becomes a frustrating guessing game. Let's explore how to implement a robust
logging system. Rust offers excellent crates for logging that go beyond stdout and stderr.
The [tracing](https://crates.io/crates/tracing) crate has become the gold standard for modern Rust applications:
```rust
fn process_request(user_id: u64) {
// Bad: just text
println!("Processing request for user {}", user_id);
// Good: structured event with context
tracing::info!(user_id, request_type = "login", "Processing request");
}
```
Output:
```bash
2025-03-21T07:55:26.540+00:00 [app] Processing request for user 999
2025-03-21T07:55:26.540+00:00 [app] INFO shuttle_telemetry: Processing request user_id=999 request_type="login"
```
While the older `log` crate remains popular, `tracing` offers richer context through its span system and structured event data. For existing
applications using `log`, the `tracing_log` adapter provides compatibility, you
can [read more about it here](https://crates.io/crates/tracing-log).
### Log Levels and When to Use Them
For better clarity of your application's behavior, it's important that you use the right log level for the right situation.
Choose appropriate log levels to balance information density with signal-to-noise ratio:
- **ERROR**: Unexpected failures requiring immediate attention
- **WARN**: Concerning events that don't prevent operation but might indicate problems
- **INFO**: Normal operational events useful for tracking application flow
- **DEBUG**: Detailed information primarily useful during development
- **TRACE**: Ultra-verbose information about internal state
In production, **ERROR** and **WARN** logs should be rare and actionable. **INFO** logs should provide a clear picture of normal operation
without overwhelming storage.
For development purposes, you can use **DEBUG** and **TRACE** to get more detailed logs, you can turn these off in production environment to
avoid overwhelming the logs.
### Using Spans to Track Request Context
A route handler might go through a few steps before ultimately returning a response to the client, during that process, multiple logs might
be emitted to the console, it would be great to see which logs belong to which request.
Without spans, if two different clients hit the same endpoint, you'd have no way to know which logs belong to which request, making it
impossible identify the request you are looking for.
```rust
async fn handle_request(req: Request) -> Response {
// Create a span for the entire request lifetime
let request_span = tracing::span!(
Level::INFO,
"http_request",
method = %req.method(),
path = %req.uri().path(),
request_id = %Uuid::new_v4(),
);
// Enter the span for this async task
let _guard = request_span.enter();
// logs in this function now have the request context
tracing::info!("Starting request processing");
let result = process_data(&req).await;
if let Err(ref e) = result {
// Error logs automatically include request context
tracing::error!(error.msg = %e, "Request processing failed");
}
tracing::info!("Completed request processing");
generate_response(result)
}
```
Spans create a hierarchy of contexts, making it easy to correlate logs from the same request even across thread or task boundaries. When
troubleshooting in production, this context can come in handy for following the execution path that led to a failure.
## Effective Error Handling
Rust offers a great way to handle errors, error propagation is one of the best developer experience features that Rust offers, but there's a
catch, if overused it can be a mess, you'll find yourself propagating everything to the bottom of the stack, without any context about what
went wrong.
In this section, we'll explore a few libraries that can help you handle errors in a more effective way, giving you proper context to
understand what went wrong.
### Error handling with `anyhow`
`anyhow` is an error handling library that provides a single error type (`anyhow::Error`) to represent all possible errors, making it easy
to propagate errors without worrying about custom enums or boilerplate.
It also provides the `Context` trait that is pre-implemented for any type that implements the `Error` trait, this allows you to add extra
context to errors, making them easier to debug.
Here's a quick example:
```rust
use anyhow::Context;
fn read_file(path: &str) -> anyhow::Result {
let content = std::fs::read_to_string(path)
.with_context(|| format!("Failed to read file at path: {}", path))?;
Ok(content)
}
fn main() -> anyhow::Result<()> {
let data = read_file("example.txt")?;
println!("File content: {}", data);
Ok(())
}
```
- `Result` is a type alias for `std::result::Result`.
- The `with_context` method is used to provide more context to the error.
```log
Error: Failed to read file at path: example.txt
Caused by:
No such file or directory (os error 2)
```
The error output shows both the error message and the source error, it's a great way to understand the root cause of the error. `anyhow` is
a great library for error handling in Rust applications, used with the `Context` trait, it's a great way to add extra context to errors,
making them easier to debug.
### Error handling with `eyre`
`eyre` is a fork of `anyhow` that gives you the same great error handling features but with additional features including custom error types
and better error messages.
Let's re-write the previous example using `eyre`:
```rust
use eyre::{Result, WrapErr};
fn read_file(path: &str) -> Result {
let content = std::fs::read_to_string(path)
.wrap_err_with(|| format!("Failed to read file at path: {}", path))?;
Ok(content)
}
fn main() -> Result<()> {
let data = read_file("example.txt")?;
println!("File content: {}", data);
Ok(())
}
```
Output:
```log
Error: Failed to read file at path: example.txt
Caused by:
No such file or directory (os error 2)
Location:
examples/eyre-ex/main.rs:5:10
```
The error output shows both the error message and the source error including the line of code where the error occurred, this can be
extremely helpful when you're debugging giving you an exact location of the error that you can quickly jump to. [Read more about
`eyre` here](https://github.com/eyre-rs/eyre).
### Custom Error Types
Internal libraries require custom error types, if your application uses some other internal libraries (common in workspaces), you'll need to
create your own custom error types to handle the errors. This can be a pain, but luckily there are libraries that can help you with this.
For a better understanding of your application's behavior, you'll need more than just the dynamic error types provided by the Rust standard
library. You can create your own custom error types per operation, you can implement the `std::error::Error` trait in your custom error
types to get a better error message.
Here's a quick implementation of the `Error` trait:
```rust
use std::error::Error;
#[derive(Debug)]
pub enum AppError {
ParseError(String),
SystemError(String),
Unknown,
}
impl Error for AppError {}
impl Display for AppError {
fn fmt(&self, f: &mut fmt::Formatter<'_>) -> fmt::Result {
match self {
AppError::ParseError(e) => write!(f, "Parse error: {}", e),
AppError::SystemError(e) => write!(f, "System error: {}", e),
AppError::Unknown => write!(f, "Unknown error"),
}
}
}
```
You'll also need to implement the `Display` trait for your custom error types, while this is useful, it can be too verbose and repetitive to
implement, let's have a look at a library that can give use some macros to make this easier.
#### Using `thiserror` to implement the `Error` trait
The `thiserror` crate helps you implement the `Error` trait for your error types in a less verbose way, it provides a derive macro that can
implement the `Error` trait with minimal code.
Here's how the code above will look like if implemented using `thiserror`:
```rust
use thiserror::Error;
#[derive(Error, Debug)]
pub enum AppError {
#[error("Parse error: {0}")]
ParseError(String),
#[error("System error: {0}")]
SystemError(String),
#[error("Unknown error")]
Unknown,
}
```
The `error` attribute takes an argument that will be used as the error message, placeholders can be used to include the error details.
This will automatically implement the `Error` and `Display` traits for your custom error types, so you'll no longer need to implement them
manually. Making your code much more concise and at the same time gives you precise control over the error messages making it easier to
debug your application.
`thiserror` also defines the `source()` method automatically for your error types, the `source()` method's job is to return the source error
if any, it's return type is `Option<&dyn Error>`, which can help you track down the root cause of the error. [Read more about the
`source()` method here](https://doc.rust-lang.org/std/error/trait.Error.html#method.source).
By combining these techniques, you'll have a better error handling system that can give you the context you need to debug your application,
use `eyre` and `anyhow` for application code and `thiserror` for internal libraries, while `anyhow` gives you a simple way to handle errors,
`eyre` gives you even more detailed error messages.
## Debugging with Rust-GDB
Sometimes you'll need more granular control over your application's execution, for that, you can use **Rust-GDB** to debug your application.
**Rust-GDB** comes in with the **Rust** toolchain, so you don't need to install it separately.
**Rust-GDB** stops the execution of the application at the breakpoint and allows you to inspect the variables and the state of the
application.
Let's have a simple example to demonstrate how to use **Rust-GDB** to debug a Rust application.
Here's a simple Rust code that calculates the area of a rectangle:
```rust
fn main() {
let width = 10.0;
let height = 20.0;
let area = calculate_area(width, height);
println!("The area of the rectangle is {}", area);
}
fn calculate_area(width: f64, height: f64) -> f64 {
width * height
}
```
Before starting **Rust-GDB**, we need to build the application in **Debug mode** with the following command:
```bash
cargo build
```
Now, we can start **Rust-GDB** with the following command:
```bash
rust-gdb target/debug/
```
You can create a breakpoint by using the following command:
```bash
b test.rs:4
```
`test.rs` is the name of the file and `4` is the line number where we want to set the breakpoint.
This will set a breakpoint at the line 4 of the `test.rs` file.
Now, we can start the application by running `run` or `r`:
```bash
run
```
This will start the application and pause execution at the breakpoint.
You can inspect the variables and the state of the application by using the `print` command:
```bash
print width
```

You can also inspect the state of the application by using the `info` command:
```bash
info locals
```
If you want to continue execution, you can type `continue` or `c` and if you want to step over the next line, you can type `next` or `n`.
See the [GDB Documentation](https://www.sourceware.org/gdb/documentation/) for more information about the commands.
Rust-GDB can come in handy when you're working with complex systems, and you need to have a better look at the execution flow of your
application.
## Telemetry
Another invaluable tool for troubleshooting Rust applications is telemetry, it's the process of collecting **metrics**, **logs**, and **traces** that help developers understand what's really going on with their applications. It answers the big questions: Is the app running
like it should? Are requests being handled quickly? Where's the slowdown?
Telemetry is a great predictor of issues, you can catch problems days before they happen, having proper telemetry setup is key to building
reliable and performant applications so that you can build with confidence, a proactive approach rather than a reactive one and solve
problems before they arise.
Telemetry and [Structured Logging](#structured-logging) can be used together to build a great monitoring system for your Rust applications.
You'll have a dashboard to monitor all your logs, metrics and resources usage all in one place.
This birds-eye view can save you from problems before they arise, in this section, we'll explore what telemetry is, and we'll set up a
simple Rust application with telemetry enabled along with a dashboard to visualize the data in only a few steps.
By the end, you'll have a basic overview of how to use telemetry to monitor your Rust applications and improve their performance and a
dashboard like the one below, by then you'll have the knowledge you need to build your own custom telemetry system for your specific needs.
Let's dive in!
### Examples of Telemetry Data
Telemetry can be collected from a variety of sources, here are some examples:
- **Tracing**: Tracks the flow of requests across services, helping identify bottlenecks or failures in distributed systems.
- **System Metrics**: CPU usage, RAM usage, disk I/O, network traffic.
- **App Metrics**: Request latency, error rates, throughput, database query times.
- **User Behavior**: Session duration, feature usage, crash reports.
- **Infrastructure**: Container health, service uptime, load balancer stats.
- **Security**: Failed logins, unusual traffic, access logs.
Collecting and processing telemetry data is a complex process, but luckily there are open source tools like **OpenTelemetry** that make the
whole process easier. However, self-hosting and maintaining **OpenTelemetry** can also be complex and resource-intensive, especially for
smaller teams.
When using **Shuttle**, we don't need to do any of that as everything is already set up for us.
### Building a Simple Web Application with Shuttle
To demonstrate telemetry in action, we'll first need to deploy a simple Rust web application to **Shuttle**. To do that, we'll need to
follow a few steps.
#### Setting up a new Shuttle project
To set up a new shuttle project, you'll have to have a Shuttle account, if you don't have one already, make sure to create one
at [shuttle.dev](https://www.shuttle.dev).
The easiest way to create a new Shuttle project is to use the Shuttle CLI. Run the following command to install the CLI:
```bash
curl -sSfL https://www.shuttle.dev/install | bash
```
This will detect your operating system and install the appropriate binary.
Once installed, you'll need to log in to your Shuttle account by running:
```bash
shuttle login
```
This will redirect you to a browser where you can log in to your Shuttle account.
Once you're logged in, you can create a new project by running:
```bash
shuttle init
```
This will prompt you to select a template for your project. For this guide, we'll use the `axum` template.
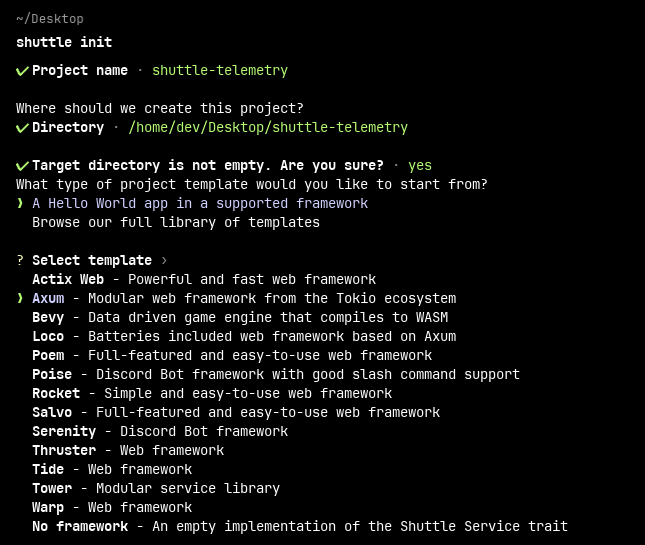
This will also ask you to create a new shuttle project (In the Shuttle console), it's important to create the shuttle project so that we can
deploy the application to Shuttle Cloud later.
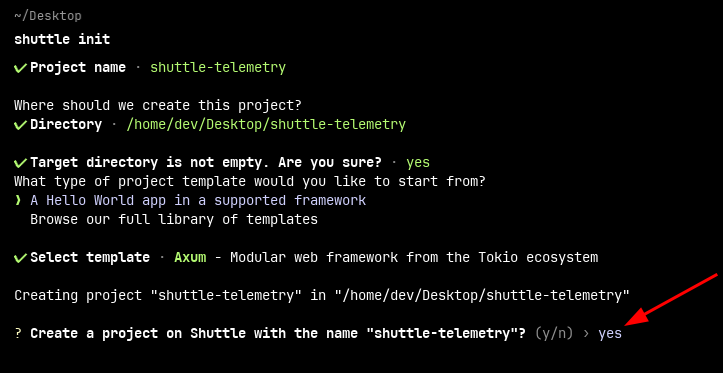
After the template selection, you can move into the project directory with:
```bash
cd my-project
```
For now, we'll keep the current _code_ as is, (which is a simple Hello World application using Axum), but we'll need to add `tracing` as a
dependency (so we can emit logs, metrics, and traces from our application), and activate the `shuttle-runtime` crate's `setup-otel-exporter`
feature (so that the emitted logs, metrics, and traces will be exported to BetterStack). We can do both easily with:
```bash
cargo add -F shuttle-runtime/setup-otel-exporter shuttle-runtime tracing
```
For reference, the application code should look like this:
```rust
use axum::{routing::get, Router};
async fn hello_world() -> &'static str {
"Hello, world!"
}
#[shuttle_runtime::main]
async fn main() -> shuttle_axum::ShuttleAxum {
let router = Router::new().route("/", get(hello_world));
Ok(router.into())
}
```
#### Deploying the application to Shuttle
To deploy the application to **Shuttle**, you can use the following command:
```bash
shuttle deploy
```
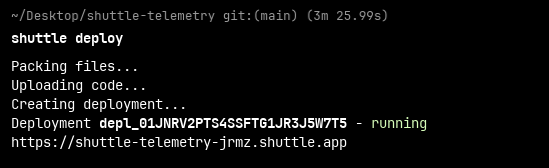
This will deploy the application to **Shuttle** and make it available at a URL.
On the Shuttle dashboard, you should see the application deployed successfully.
That's it! Our application is now deployed to **Shuttle**, and we can now enable telemetry.
#### Setting up Telemetry for Shuttle
We'll need to export the telemetry data of the application to **BetterStack** which will collect the data and will let you build dashboards
and visualize the data.
**Shuttle** uses **Open Telemetry** behind the scenes to collect telemetry and **BetterStack** has support for it, so the integration is a
seamless process.
You'll need to create a **BetterStack** account, if you don't have one already, make sure to create one
at [betterstack.com](https://betterstack.com/).
Once you have a **BetterStack** account, you can add a new source for telemetry in **BetterStack**. In the **Sources** tab, click the **Connect Source** button.
This will give you a list of options to choose from, choose the **OpenTelemetry** option.
Give your source a name and select the **OpenTelemetry** option.
After that, you can scroll down and press the **Connect Source** button, or you can press enter when focusing on the source name input.
This will create your source and give you the necessary credentials to connect BetterStack to Shuttle.
Now that your BetterStack source is created, you can go back to the Shuttle project page and enable telemetry for your application.
This will prompt you to enter your BetterStack credentials, source token and the ingesting host that was provided in the previous step.
You should now see the telemetry status as **Enabled** on the Shuttle project page.
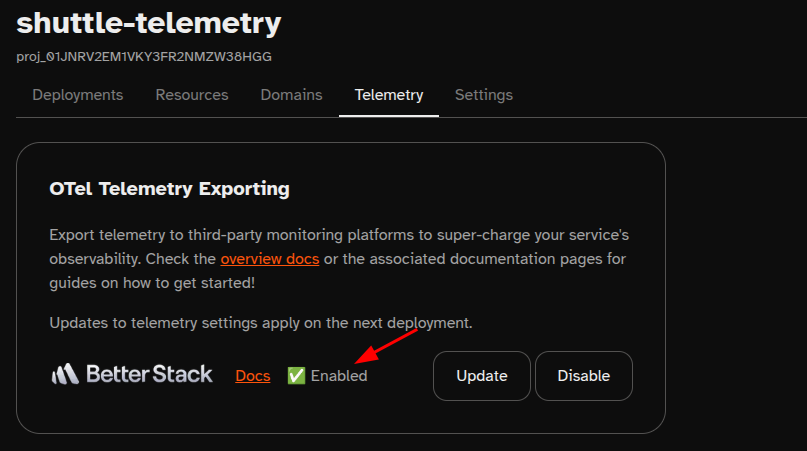
> Note: If you have already deployed your application before enabling telemetry, you'll need to redeploy your application to start
> collecting telemetry data. Simply navigate to the **Deployments** tab and select the latest deployment and click **Redeploy**.
Telemetry collection happens automatically (as long as the `shuttle-runtime` crate's `setup-otel-exporter` feature is enabled), so you don't
need to do anything else. To see which telemetry data is being
collected, [see the Shuttle telemetry docs](https://docs.shuttle.dev/docs/telemetry/overview).
The telemetry data available to you depends on your Shuttle tier. The Community tier provides essential system metrics including CPU usage, memory usage, network I/O, and disk I/O. For full access to all telemetry data including application metrics, logs, and traces without export limits, you'll need a Pro or Growth tier subscription. The good news is that Shuttle offers a free trial of both the Pro and Growth tier, giving you an opportunity to explore all the telemetry features before committing to a subscription. You can set up your trial by visiting the [billing page](https://console.shuttle.dev/account/billing) in your Shuttle account.
In the next step, we'll explore BetterStack to build dashboards and visualize our telemetry data.
#### Building Dashboards with BetterStack
Telemetry data is only useful when visualized, **BetterStack** allows you to build custom dashboards and graphs based on the data you
collect.
When we first created the source, a default dashboard was automatically created for us. We can navigate to the **Dashboards** page and
configure it to our liking.
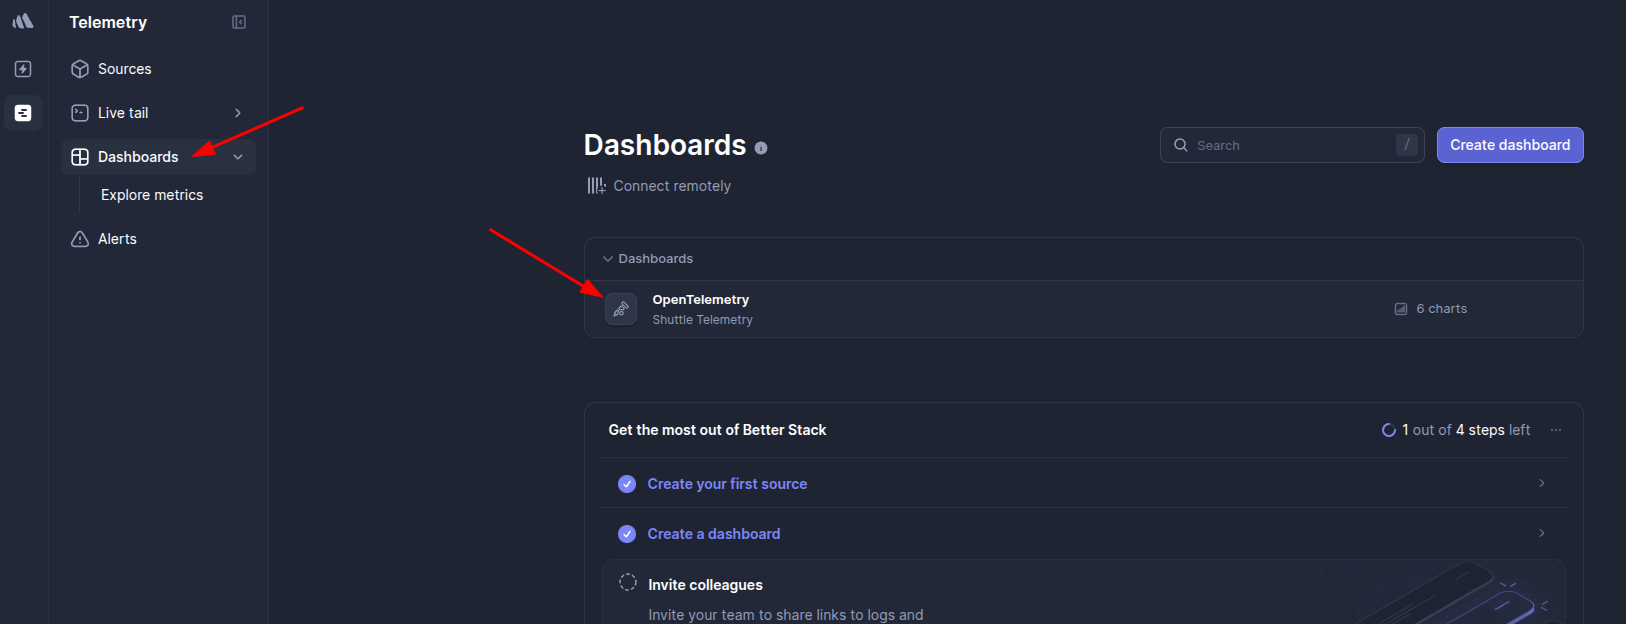
This will take you to the default dashboard that was created for us.
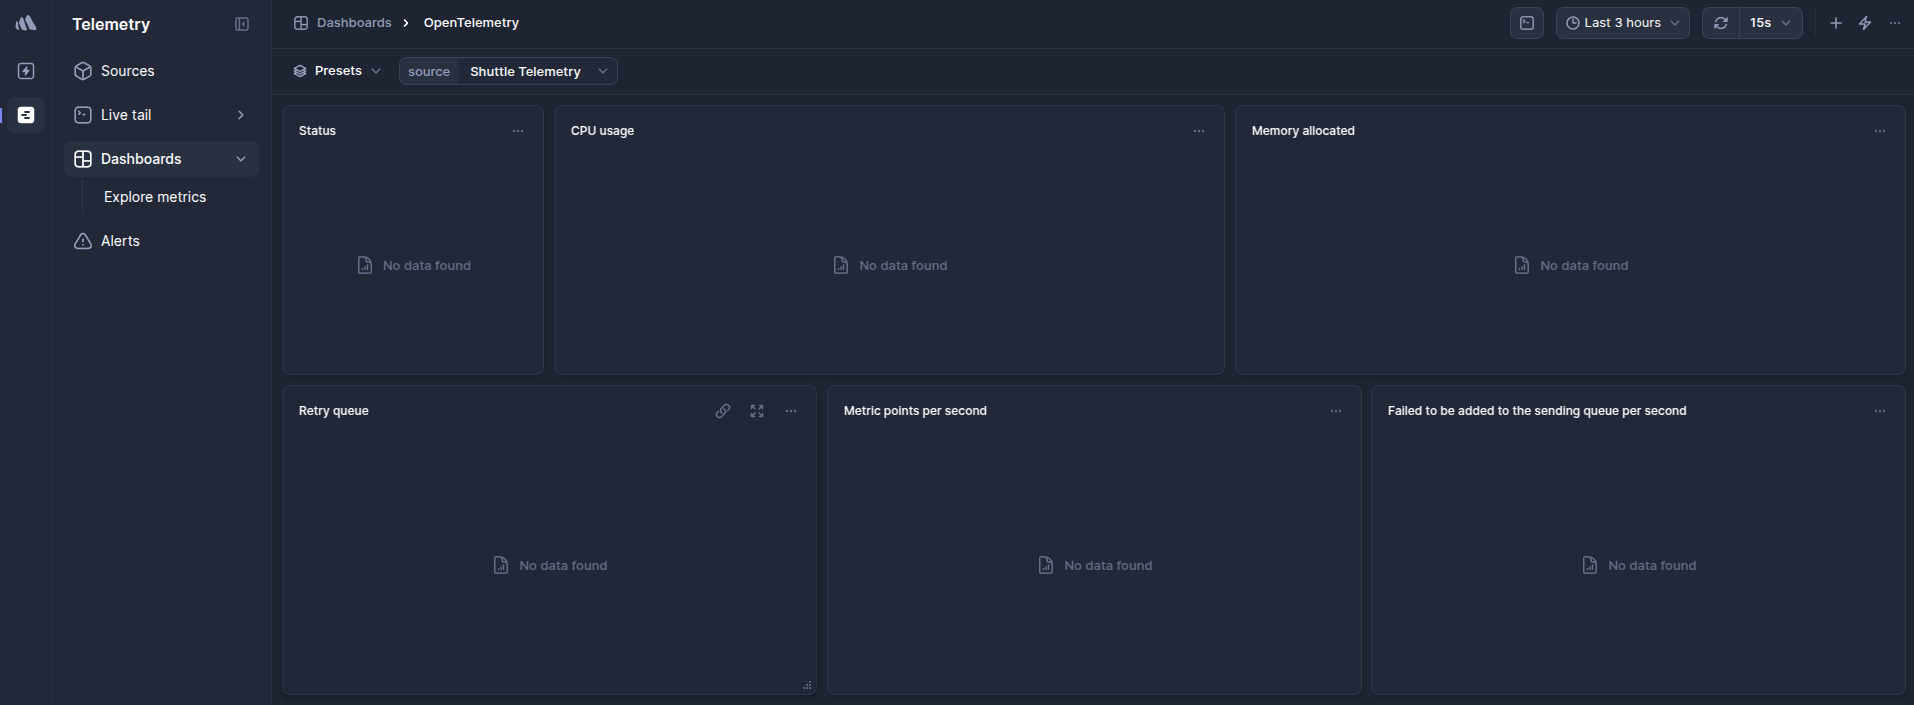
As you can see, the default dashboard is created with a default layout, but there is no data to be displayed yet, we need to do a few
adjustments to get the data to be displayed the way we want.
Let's start by adding a **CPU Usage** widget, Shuttle exports the vCPU usage for each project, let's see how much is being used for our
project.
Click on **Configure** to the right of the widget.
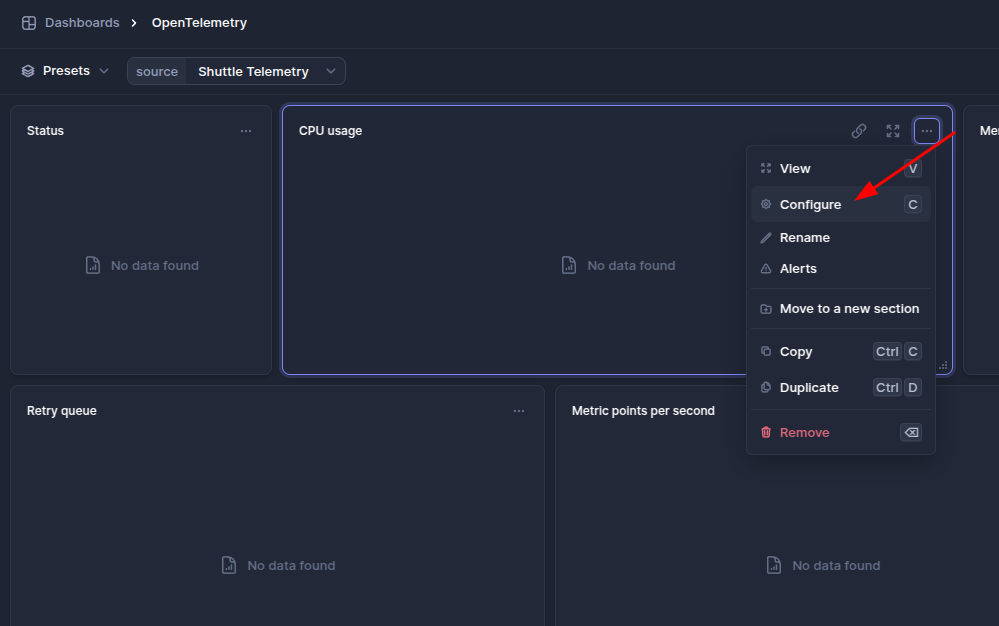
On the configuration page, select the **Drag and Drop** option, this will allow us to customize the widget with a more user-friendly
interface.
Search for **vCPU** and click on the `cpu.usage.vcpu` option.
The default configuration will measure in percentage, we need to update the Y-axis to measure in virtual CPUs (vCPUs).
Change the Y-axis unit to **vCPUs** and click on the **Save** button.
Now we can see the vCPU usage for our project.
Going back to the dashboard, you should see the widget updated with the correct data.
You can add more widgets with other metrics to get a better understanding of your data.
See [this page](https://docs.shuttle.dev/docs/telemetry/overview) to see all the exported metrics by Shuttle.

That's it! We have a basic dashboard showing vCPU usage for our project, which is key for spotting issues like resource exhaustion or
performance bottlenecks. Telemetry tools help you catch problems early—whether it's high CPU usage, memory leaks, or slow response times.
#### Exporting Tracing Data to BetterStack
In the previous section [Structured Logging](#structured-logging), we went over how to use the `tracing` crate effectively to structure logs and track request context using spans. When using Shuttle with the `shuttle-runtime/setup-otel-exporter` feature enabled, these structured logs and spans are automatically collected and exported via OpenTelemetry.
This means your `tracing::info!`, `tracing::warn!`, etc., events, along with their associated spans and key-value pairs, will appear in **BetterStack** without extra configuration.
You can [read more](https://docs.shuttle.dev/docs/telemetry/custom-metrics) about the custom events you can emit using the `tracing` crate.
Let's dive in with some real life examples.
We need to have the feature `setup-otel-exporter` enabled for the `shuttle-runtime` crate in our `Cargo.toml` file.
```toml
[dependencies]
shuttle-runtime = { version = "0.53", features = ["setup-otel-exporter"] }
```
This is important for exporting the traces to **BetterStack**.
##### 1. Tracking User Signups (Monotonic Counter)
It's common for most businesses to want to track the number of users who have signed up over time, this is a great use case for a monotonic counter.
To track the total number of users who have signed up over time, you can use a monotonic counter. This counter only ever increases. Emit a tracing event with a field prefixed by `monotonic_counter.` whenever a signup occurs.
```rust
use rand::Rng;
async fn user_signup() -> &'static str {
let mut rng = rand::rng();
let user_email = format!("user{}@example.com", rng.random_range(1000..9999));
tracing::info!(monotonic_counter.user_signups = 1, %user_email, "New user signed up");
"User signup recorded"
}
```
In BetterStack, you can then create a graph for the metric `user_signups` (or similar, depending on collector naming) to visualize the signup trend. The `email` field will be attached as an attribute to the log event itself.
##### 2. Tracking Active Users (Up/Down Counter)
To monitor the number of currently logged-in users, you can use an up/down counter (gauge). Increment the counter on login and decrement it on logout. Emit tracing events with fields prefixed by `counter.`
```rust
use uuid::Uuid;
async fn user_login() -> &'static str {
let user_id = Uuid::new_v4();
tracing::info!(counter.active_users = 1, %user_id, "User logged in");
"User login recorded"
}
async fn user_logout() -> &'static str {
let user_id = Uuid::new_v4(); // In reality, you'd get this from session/token
tracing::info!(counter.active_users = -1, %user_id, "User logged out");
"User logout recorded"
}
```
This allows you to visualize the `active_users` metric in BetterStack, showing the real-time count of users currently using the application.
These simple metric conventions within `tracing` provide a convenient way to gain insights into specific application events directly alongside your logs and traces in your observability platform.
##### Visualizing Custom Metrics in BetterStack
Let's visualize the data that we've been tracking in the previous sections.
We need to add a **Custom Metric** in **BetterStack** to be able to visualize the `user_signups` and `active_users` metrics. Let's create both metrics.
Navigate to the create chart page and click on the **Create Metric** button.
On the next page, click on the button **+ Metric** to add a new metric.
Give your metric a name, for example `user_signups` and for the **JSON dot notation** field, enter `monotonic_counter.user_signups` this is the name of the metric that we used using the `tracing::info!` macro.
You can press the **Preview** button to see if **BetterStack** hsa received those events from **Shuttle**, if you have triggered those events, you should see the data in the preview.
If you see the correct data, you can then press **Create Metric** to save the metric.
We'll do the same for the `counter.active_users` metric as well.
##### Creating charts to visualize the metrics
Now that we've introduced the details to BetterStack about our metrics, we can create charts to visualize the data. The process is the same as we did earlier for the vCPU usage widget, we'll create a new chart and add a new widget.
We can now see how many active users we have at any given time and also the number of signups over time. This data is always updated in real-time based on the events that are being emitted from our application.
## Conclusion
Troubleshooting Rust web applications can be challenging, but with the right tools and techniques, it becomes a manageable and even
insightful process. From structured logging with `tracing` to robust error handling using `anyhow`, `eyre` and `thiserror`, `rust-gdb` for
debugging, and leveraging telemetry for real-time insights, Rust provides a rich ecosystem to help you identify and resolve issues
effectively.
By combining these approaches, you can build applications that are not only performant and reliable but also easier to debug and maintain,
you'll catch errors before they happen, have a birds-eye view of your application's performance and resources usage, and you'll be able to
troubleshoot issues faster and more effectively.
---
# Introducing New Shuttle Pricing: Simple and Production-Ready
Source: https://www.shuttle.dev/blog/2025/03/19/pricing-update
Date: 19 March 2025
Author: shuttle
Tags: shuttle
Following the launch of our new platform late last year, we're updating our pricing structure
Following the launch of our new platform late last year, we're updating our pricing structure to better reflect our evolution into a production-ready platform that developers can rely on for their most critical services.
We're particularly excited to introduce our **new Growth Tier**, designed specifically for teams with more complex production workloads that need to handle significantly more traffic and team collaboration features.
We want to be transparent about what's changing and why these changes will better serve you, whether you are an individual developer or a growing team.
## Why We're Updating Our Pricing
1. Provide production-ready infrastructure with enhanced isolation, reliability, and monitoring across all tiers
2. Balancing generosity of the free tier with long-term platform sustainability
3. Making it even clearer what you get and what you pay for, responding to some of your feedback
4. Support users with rapid scaling needs
5. Enable team collaboration features
We've carefully balanced these adjustments by significantly increasing computing power and adding capabilities that matter most for real-world applications.
## Our Updated Pricing Tiers
### Community Tier: Focused and More Powerful
**Free Forever**
We've enhanced our free tier to better serve developers learning Rust and get meaningful projects off the ground:
- **5x more computing power**: 0.25 vCPU (from 0.05)
- **2.5x more memory**: 0.5GB RAM (up from 0.2GB)
- **Custom domain support** included
- **Running Projects**: 1 project (from 3) perfect for showcasing what you can do in Rust
- **Spot Instance**: Instances may occasionally restart to maintain optimal platform performance
- **7x longer log retention**: 7 days (up from 1 day)
- **Monitoring & Observability**: Basic resource usage metrics through third-party integrations
- **Simplified builds**: 100 build minutes per month
- **Database storage**: 0.5GB (plenty to start small or experiment)
While we've reduced the number of projects, each project now gets significantly more computing resources, making it possible to build and run more demanding applications.
### Pro Tier: Production-Ready Infrastructure
**$20/month + usage** with a 14 day free trial! (excluding usage)
If you're running production apps or you've outgrown the Community tier, the Pro plan is here to keep you covered:
- **Reserved instances**: Dedicated resources with full VM isolation
- **Scalable vCPU & Memory** to support larger need**s**
- **3 projects included:** Down from 15
- **Add more projects: Add** up to 10 projects
- **Minimum size for additional projects:** 0.5 vCPU and 1GB of Memory
- **Monitoring & Observability**: Custom application metrics, logs & traces
- **14-day log retention** (up from 7)
- **Network egress included adjusted to 1GB** (from 10GB).
- **Shared database storage included is now 0.5GB** (from 10GB).
- **Usage-based pricing** for more flexibility
- **Enhanced support**: 1-business day response time and migration assistance
We've moved to a more flexible usage-based model where you only pay for what you need beyond the basic allocation, focusing on a stable, production-ready environment - plus our new monitoring integration helps you keep everything running smoothly.
### Growth Tier: Scale with Confidence (New!)
**Starting at $250/month + usage** with a 14 day free trial! (excluding usage)
For teams with more complex production workloads or the need to handle more traffic.
- **10 projects included** (scalable up to 50)
- **Minimum size for additional projects:** 0.5 vCPU and 1GB of Memory
- **Horizontal scaling** with configurable replicas (up to 10 instances per project)
- **Zero downtime deploys** with rolling deployments
- **Load balancing** up to 1,000 requests per second
- **Dedicated database** for consistent performance
- **Team access** for up to 10 users
- **30-day log retention**
- **Priority business support** in either Discord or Slack with a dedicated channel
If your organization needs collaboration features or you want to scale seamlessly, Growth Tier offers robust infrastructure without the complexity of managing it yourself.
### Enterprise Tier: Built for Big Ambitions (Coming Soon)
**Custom pricing + usage**
For large organizations with advanced security, compliance, or custom infrastructure needs.
- **Bring your own cloud or single tenant** options
- **Custom hardware configurations**
- **Multi-region flexibility**
- **Advanced Security & Compliance**
- **Custom CI Pipelines**
- **Priority support** with custom SLA
- **Architecture design reviews**
If you have strict operational, security, or compliance needs - or want to integrate Shuttle deeply into your existing ecosystem - stay tuned for Enterprise.
## Supporting Your Transition
We understand that pricing changes can impact your projects. To ensure a smooth transition:
- **Existing projects**: Will continue running with current resources for 30 days
- **Migration support**: Our team is available in Discord to help with questions
## Frequently Asked Questions
**Q: Why reduce the number of projects in** the **Community and Pro tiers?**
A: With our new VM isolation and increased computing power per project, we're focusing on giving developers more resources for meaningful applications rather than many smaller projects.
**Q: How does usage-based pricing work?**
A: Your subscription includes base allocations, with transparent per-use pricing for additional resources like compute, storage, and bandwidth.
**Q: What happens to my existing projects?**
A: All existing projects will continue running without interruption during the 30-day transition period, giving you time to adjust to the new resource allocations.
Check out our [complete FAQ](/) for more details on billing, upgrading/downgrading, and resource management.
## Get Started
Ready to explore the new Shuttle?
- View detailed [pricing and resource information](https://www.shuttle.dev/pricing)
- Read our [documentation](https://docs.shuttle.dev/)
- Join our [Discord community](https://discord.gg/shuttle) for support
We're excited about these changes and how they'll help you build better applications. Our team is here to support you through this transition and beyond. Let's build something amazing together! 🚀
---
# Exporting your metrics to Better Stack with Shuttle
Source: https://www.shuttle.dev/blog/2025/02/19/using-shuttle-with-betterstack
Date: 19 February 2025
Author: josh
Tags: shuttle, observability
How to use Shuttle's new M&O feature to send your metrics to Better Stack
## Introduction
We're excited to announce the official integration of Better Stack with Shuttle! This new integration makes it easier than ever to export your metrics from Shuttle to Better Stack, allowing you to gain real-time insights into the performance of your applications. Whether you're monitoring system health, analyzing traffic patterns, or troubleshooting issues, Better Stack's powerful visualization tools combined with Shuttle's seamless metrics export will empower you to stay on top of your project's observability like never before. In this article, we'll guide you through the simple setup process to start leveraging this integration today.
## Getting set up
To get started, you'll need two things:
1. A BetterStack account. If you don't have one, you can sign up [here.](https://betterstack.com/)
2. A Shuttle project you'd like to add telemetry to (or a new project).
Note that once you add the BetterStack integration, you'll need to re-deploy your project. If you haven't deployed your project before, you can just deploy it and it'll have BetterStack telemetry (if you've enabled the BetterStack integration _prior_ to deploying for the first time).
## Adding a new telemetry source
The first thing you'll need to do once you've logged into BetterStack is to click onto the Sources section, then go to Connect Source which will allow you to add a new telemetry source for BetterStack.
Once you've chosen a name for your new telemetry source (we _generally_ use the project name, but you're free to use any name you'd like), click the OpenTelemetry option in the "platform" section:
Once done, scroll _all the way_ to the bottom of the page and hit the "connect source" button:
Next, grab the source token from the new menu (note that if you just click on the field it should automatically copy the value for you).
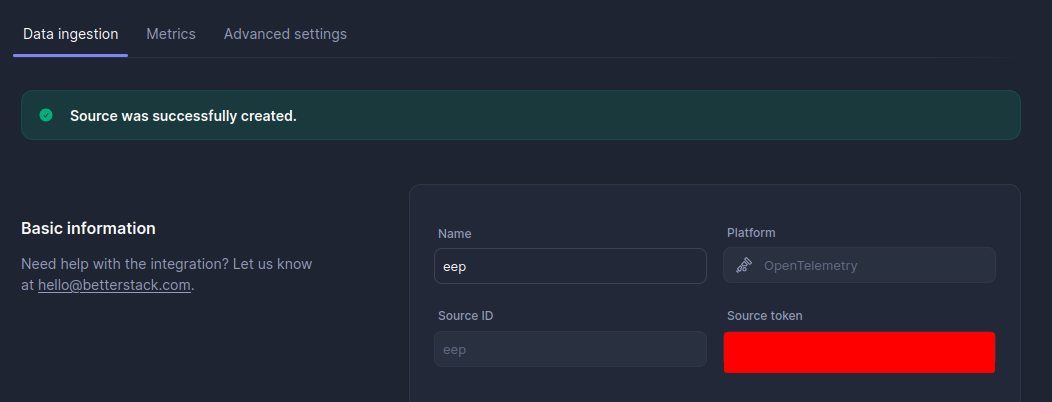
Next, you'll need to navigate to the project you want to enable telemetry for in your Shuttle console by clicking on it on the left hand side (or from the projects menu), clicking on the Settings tab, then clicking to enable BetterStack. Paste your source token in, then press Apply.
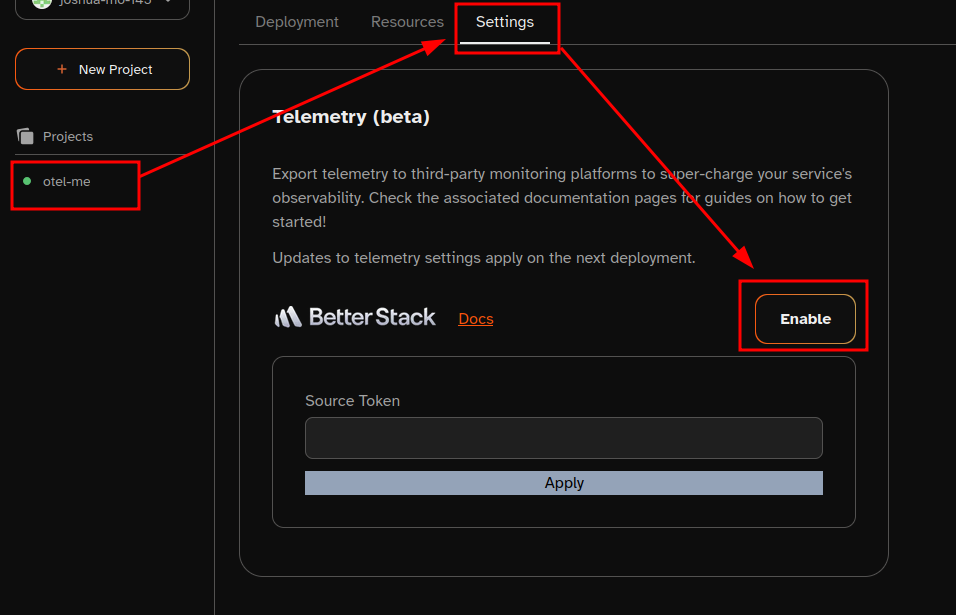
> **Reminder**: if your project was already running when you clicked "Apply", you'll need to redeploy it before telemetry will start to flow. If you haven't deployed your project for the first time yet, telemetry will start flowing immediately when you do.
Done! Now let's talk about how to use the telemetry export.
## How to use the telemetry export
Shuttle by default sets up a `tracing_subscriber` that will automatically log information to stdout. Now that you've set up BetterStack, we'll need to tell it to also send telemetry data to BetterStack. To get started, you'll need to add the `setup-otel-exporter` feature to `shuttle-runtime` . You can do this by running the following command:
```bash
cargo add shuttle-runtime -F setup-otel-exporter
```
Optionally, you can manually adjust the dependency in your `Cargo.toml` if you prefer:
```toml
shuttle-runtime = { version = "0.52.0", features = ["setup-otel-exporter"] }
```
Next, you'll need to ensure your project has `tracing` as a dependency as well. As before, you can add it with `cargo`:
```markdown
cargo add tracing
```
Optionally, you can manually add it as well, just be sure to check [crates.io](https://crates.io/crates/tracing) for the most recent version.
Once you _have_ `tracing` available in your project, all you need to do is add some tracing to the functions you're using. Like so:
```rust
async fn hello_world() -> &'static str {
tracing::info!(counter.hello = 1, "Hello world from OTel!");
"Hello, world!"
}
```
Doing this will send an `info` level log to stdout, as well as BetterStack, saying `Hello world from OTel!`. The log object in BetterStack will look something like this (note that log exports are a Pro feature):
```json
{
"attributes": {
"code.filepath": "src/main.rs",
"code.lineno": 4,
"code.module_path": "otel_me",
"counter.hello": 1
},
"dropped_attributes_count": 0,
"dt": "2025-02-04T15:56:27.068644985Z",
"message": "Hello world from OTel!",
"observed_timestamp": "2025-02-04T15:56:27.068649239Z",
"resources": {
"service.name": "otel-me",
"service.version": "0.1.0",
"shuttle.deployment.env": "production",
"shuttle.project.crate.name": "otel_me",
"shuttle.project.id": "proj_01JK8SHBZQ0XF0TKW0EDWBJ8NH",
"shuttle.project.name": "otel-me",
"telemetry.sdk.language": "rust",
"telemetry.sdk.name": "opentelemetry",
"telemetry.sdk.version": "0.27.1"
},
"severity_number": 9,
"severity_text": "INFO",
"source_type": "opentelemetry"
}
```
You can additionally see here that we have added a counter - because we use `tracing-opentelemetry` under the hood, Shuttle supports three types of metrics you can use: monotonic counters, counters and histograms. You can find more about this [on the `tracing-opentelemetry` docs.](https://docs.rs/tracing-opentelemetry/latest/tracing_opentelemetry/struct.MetricsLayer.html)
## Creating Betterstack dashboards from OTel data
Now that we've done the hard part, we can create some dashboards from the data. If you go back to the telemetry section of the BetterStack dashboard, you can check out Dashboards where a new dashboard will have been created for you automatically. You can check out the dashboards like so:
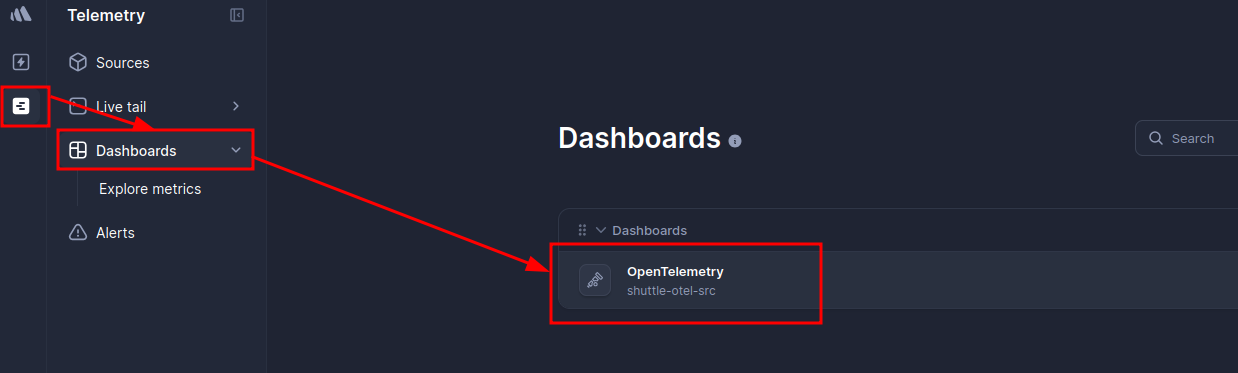
Next, you'll see some dashboard widgets that have been automatically created but will likely show "empty" (they're generic and assume the metrics being visualized are actually the _internal_ metrics of an OpenTelemetry collector instance, which your project is obviously not 😅).
The default view for configuring widgets is [SQL](https://betterstack.com/docs/logs/dashboards/sql-queries/), but BetterStack also offers:
- [metrics-from-filtered-logs](https://betterstack.com/docs/logs/dashboards/logs-to-metrics/)
- [promql (beta)](https://betterstack.com/docs/logs/using-logtail/simplified-promql/)
- a visual drag-and-drop interface
> **Note:** Naturally, you're free to use the method that suits you best, but we generally recommend the drag-and-drop interface.
Check out how we created our own graph to measure CPU usage by adding in `cpu_usage_vcpu` against our project name. We've also set the Y axis to use vCPU units.
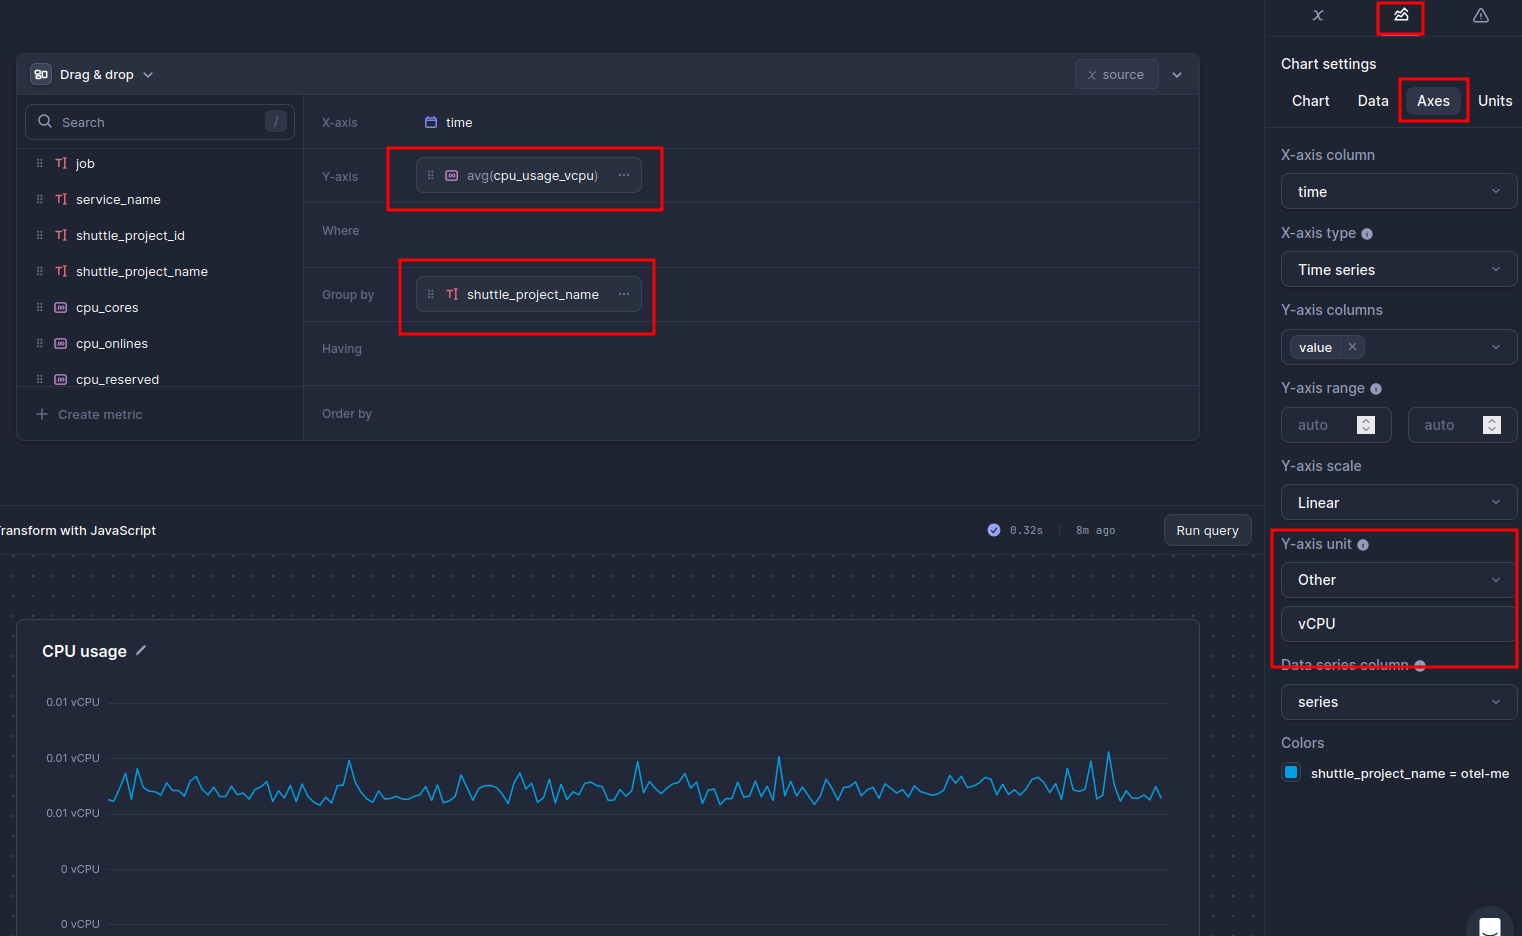
You can also additionally find out more about what other values you can use by checking out our API reference.
---
# What even is observability, anyway?
Source: https://www.shuttle.dev/blog/2025/02/17/what-is-observability-rust
Date: 17 February 2025
Author: josh
Tags: rust, observability
Looking at what observability is, how it can help you and how to use it with Rust & Shuttle
## Introduction
You've probably heard the term "observability" thrown around, but what does it actually mean? At its core, it's all about making your systems easier to understand and troubleshoot by seeing what's going on inside them. It's more than just logs and metrics—it's about having a clear view of your system's health in real-time. In this article, we'll break down what observability really is and why it's crucial for keeping your apps running smoothly.
## What makes observability useful?
Observability can be as simple or as powerful as you want. It can be something like this:
```rust
println!("I just did a thing!")
```
Or it can be all the way up to complete distributed tracing systems that outputs every span down to the trace in Datadog and also archives your logs in S3. Both have their use cases and have varying levels of complexity for a technical implementation.
Either way, observability is an important part of being able to debug issues within your application. It's even moreso important in production because when things break, there's consequences - typically in the form of your customers voting elsewhere with their wallet. Nobody wants that (except your competitors).
## A quick look at the observability ecosystem
The ecosystem for observability is quite sizeable. There are complete observability solutions like [Grafana](https://grafana.com/) (which is self-hostable) and [Datadog](https://www.datadoghq.com/), there are also specialized tools focused on specific aspects like [Prometheus](https://prometheus.io/) for metrics collection, [Elasticsearch](https://www.elastic.co/elasticsearch) for log aggregation, and [Jaeger](https://www.jaegertracing.io/) for distributed tracing. These tools often integrate with each other, providing a more holistic view of system performance and health. Other solutions like [Honeycomb](https://www.honeycomb.io/) and [New Relic](https://newrelic.com/) offer deep insights into application behavior, with an emphasis on high-resolution data for debugging and optimizing complex systems.
In the Rust ecosystem, while observability isn't as mature as in other languages, there are promising tools emerging. Crates like `tracing` and `tokio-console` are gaining traction for their ability to provide structured logging and performance insights, making it easier for Rust developers to monitor and debug their applications. These tools, combined with integrations into cloud observability platforms, make it easier to build performant and reliable systems.
## Powerful tracing with OpenTelemetry
Many of the aforementioned platforms also support OpenTelemetry (often referred to as OTel) - which is an open standard that allows telemetry tools, platforms, and services from different vendors to operate together. It provides reference implementations of SDKs in all popular programming languages, as well as a data collector process that can receive the telemetry data from a variety of sources, transform it, and send to a variety of consumers. They even have native Rust support with their `opentelemetry` crate as well as their [tracing-opentelemetry](https://docs.rs/tracing-opentelemetry/latest/tracing_opentelemetry/) crate. This is huge, as Rust is typically a popular choice for distributed systems.
### How does it work?
Unlike regular logging systems, OpenTelemetry expands upon the idea of "spans" as unit of work within your program. These spans can represent either a unit of time, or some function execution (for example). Those spans are often used in traces and can consist of either more spans or lower-level operations which can correlate to what is happening at the time of a recorded span - for example, a database record insertion operation. Spans can also additionally have attributes which act as labels which allows the receiving observability platform to facilitate navigation between different spans/traces.
While this is initially much more confusing than "just logs", it adds much more context which can additionally be shared over multiple machines or systems. This allows you to create a much more complete picture of what may have caused an incident. For example, let's say you want to know what happened in a service in a VM that sent a request to another service in a different VM which has then crashed. By aligning the IDs of the traces, you can create a full picture of the workflow up until that point.
Interested in trying it out? Check out [our guide on using OTel.](https://www.shuttle.dev/blog/2024/04/10/using-opentelemetry-rust)
## How do I use observability on Shuttle?
We're excited to announce that **starting this Wednesday**, all users will have access to our new telemetry integration for BetterStack. Our Shuttle runtime takes care of the whole process for you end-to-end, allowing you to simply use your API key with a relevant supported provider and it'll **just** work. Beyond our initial launch, we also have plans to expand to other provide other telemetry export destinations.
What observability platform would you like to see supported next? [Send a message in our Github discussion now.](https://github.com/shuttle-hq/shuttle/discussions/1980)
---
# Provisioning TLS Certificates in Rust With ACME
Source: https://www.shuttle.dev/blog/2025/02/06/provisioning-tls-certificates-with-acme-in-rust
Date: 6 February 2025
Author: oddgrd
Tags: rust, acme, tls
How we provision TLS certificates for custom domains in Rust using the `instant_acme` crate.
## Introduction
At Shuttle, we enable users to easily deploy their Rust backend applications to our platform. Each
deployed application can receive HTTPS traffic at its default domain:
`-.shuttle.app`. We use a wildcard certificate that automatically covers all
subdomains of `shuttle.app`. However, users can use any custom domain they want, and we need an
SSL/TLS certificate for each.
To facilitate this, users can request a certificate for any domain they own through the
[Shuttle CLI](https://docs.shuttle.dev/docs/domain-names#set-up-ssl-certificate), after setting a
DNS record that points their domain to our public IP. To streamline this process, we needed a
simple, automated way to provision multiple certificates from a trusted certificate authority.
This is where the ACME protocol comes into play.

## The ACME Protocol
The ACME (Automated Certificate Management Environment,
[RFC 8555](https://datatracker.ietf.org/doc/html/rfc8555)) protocol was developed by the
[Internet Security Research Group](https://en.wikipedia.org/wiki/Internet_Security_Research_Group)
for their Let's Encrypt service. It is an open standard that allows for the automated provisioning
and renewal of certificates from a certificate authority. [Let's Encrypt](https://letsencrypt.org/)
is the most popular certificate authority that implements ACME, and in fact the only way to get a
certificate from them is with an ACME client. They're a non-profit, with the express goal of making
the internet more secure by allowing anyone to easily obtain certificates, free-of-charge. We use
Let's Encrypt at Shuttle, but there are other certificate authorities that implement the ACME
protocol, for example [ZeroSSL](https://zerossl.com/) and
[Google Trust Services](https://pki.goog/).
Now we know a little bit at a high level about ACME, but how does it work in practice?
## ACME Challenges
The ACME protocol allows us to provision certificates from an ACME server programmatically. However,
for us to be allowed to provision a certificate for a given domain, we must first prove that we
control that domain. In the ACME paradigm that is done by completing a challenge, and in the current
version of the ACME standard, there are three
[challenge types](https://letsencrypt.org/docs/challenge-types/).
### HTTP-01
This is the simplest and most commonly used challenge, and the one we currently use to support
custom domains on Shuttle. For this challenge, you need to start a server under the domain you are
requesting a certificate for, that is reachable by the ACME server (e.g. Let's Encrypt) on port 80.
The ACME server will send an HTTP request to the endpoint
`http:///.well-known/acme-challenge/`, and it will expect a specific value in
the response, which we'll go in depth on later.
The main drawbacks to using this challenge type, is that it does not support provisioning
certificates for wildcard domains. Furthermore, it requires you to serve the challenge response on
port 80, which depending on your infrastructure setup can be challenging.
For the practical part of this article, we'll focus on this challenge type.
### DNS-01
This challenge requires you to prove that you control the DNS for a domain by putting a specific
value under a TXT record in the DNS zone for that domain. The ACME server will then do an
authoritative lookup for the record, and if it has the right value, you'll be allowed to provision
a certificate. This can be challenging to automate, since you're reliant on your DNS provider to
have an API you can call to set the TXT record.
At Shuttle, we use this challenge internally when we provision a certificate for our default
wildcard domain, `*.shuttle.app`. In the future, we will use it to allow users to request
certificates for wildcard custom domains, as this is the only challenge type that can be used for
wildcard certificates. We will then initiate the challenge on our end, before returning the value
to the user, along with instructions on how to set it in a TXT record in their DNS.
### TLS-ALPN-01
Like the HTTP-01 challenge, this challenge, which is developed as a
[separate standard](https://datatracker.ietf.org/doc/html/rfc8737), also requires you to run a
server on your domain that is reachable by the ACME server. But unlike HTTP-01, you don't need to
serve it on port 80. You are required to start a TLS server on port 443, that responds to specific
connection attempts using the ALPN extension with identifying information. To prove that you control
the domain, when the ACME server makes a connection to an address that is resolved for your domain,
you need to present a self-signed certificate with some identifying information, as well as a signed
challenge token.
## Using an ACME client in Rust with `instant_acme`
It's time to see how this all works in practice, in Rust! Thanks to the Rust open-source community,
we don't have to implement our ACME client from scratch. There are a couple of crates to choose
from, but the most up-to-date and actively maintained is the
[`instant_acme`](https://github.com/djc/instant-acme) crate, built on top of `tokio` and `rustls`.
It supports all the ACME challenge types mentioned above.
### Creating an ACME Account
The first step in the ACME certificate provisioning flow is creating an
[ACME account](https://datatracker.ietf.org/doc/html/rfc8555#section-7.1.2), which `instant_acme`
makes very simple. When we call `Account::create`, the library sets up a Hyper client under the hood
and creates an
[ECDSA key pair](https://en.wikipedia.org/wiki/Elliptic_Curve_Digital_Signature_Algorithm), and
there we have it, our ACME client! We'll re-use this client and key pair throughout the provisioning
process.
The public key from the key pair will be included in the account creation request, and the request,
as well as future requests using this client, will be signed using the private key. We'll use the
Let's Encrypt staging environment for this example, since it's
[recommended for development and testing](https://letsencrypt.org/docs/staging-environment/).
```rust
use instant_acme::{LetsEncrypt, NewAccount, Account};
use anyhow::Context;
#[tokio::main]
async fn main() -> anyhow::Result<()> {
let account = NewAccount {
// Optionally add a list of contact URIs (like mailto:info@your-domain.com).
contact: &[],
terms_of_service_agreed: true,
only_return_existing: false,
};
// We'll use methods on the returned account struct for future calls to the ACME server.
let (account, _credentials) = Account::create(&account, &LetsEncrypt::Staging.url(), None)
.await
.context("failed to create acme account")?;
}
```
### Creating an ACME Order
With our account set up, we're ready to create an
[order](https://datatracker.ietf.org/doc/html/rfc8555#section-7.1.3) for a certificate. The order
struct is a simple state machine, in accordance with the ACME spec. It has a status, a list of
authorizations and an optional certificate. We'll go through the various steps of the order to drive
the state to `Ready`, at which point we'll be allowed to request a certificate.
The order will have one authorization per domain we request a certificate for, that the ACME server
requires the client to complete. For each authorization, we need to chose which challenge type we
want to complete, e.g. HTTP-01 or DNS-01. For this example, we'll use an HTTP-01 challenge.
> The instant_acme repository provides an
> [example using a DNS-01 challenge](https://github.com/djc/instant-acme/blob/main/examples/provision.rs),
> which the example below using HTTP-01 is largely based on.
```rust
use instant_acme::{
AuthorizationStatus, ChallengeType, Identifier, NewOrder
};
use anyhow::{bail, Context};
#[tokio::main]
async fn main() -> anyhow::Result<()> {
[...]
let domain = "my-domain.com";
// Using the account we created earlier, create an order for our domain.
let mut order = account
.new_order(&NewOrder {
identifiers: &[Identifier::Dns(domain.to_string())],
})
.await
.context("failed to order certificate")?;
// Request authorizations for our order from the ACME server.
let authorizations = order
.authorizations()
.await
.context("failed to retrieve order authorizations")?;
// There should only be 1 authorization as we only provided 1 domain above.
let authorization = authorizations
.first()
.context("there should be one authorization")?;
if !matches!(authorization.status, AuthorizationStatus::Pending) {
bail!("order should be pending");
}
// We want to complete an HTTP-01 challenge for this example, so we
// extract it from the authorization. It holds the token we need to
// complete the challenge.
let challenge = authorization
.challenges
.iter()
.find(|c| c.r#type == ChallengeType::Http01)
.ok_or_else(|| anyhow::anyhow!("no http01 challenge found"))?;
}
```
### Setting Up An HTTP-01 Challenge Server
Now, as I mentioned earlier, to complete an HTTP-01 challenge we need to serve a specific value at
the `http://my-domain.com/.well-known/acme-challenge/{*token}` endpoint. The token will be in the
challenge we received from the ACME server with our order. For any request to this endpoint, we will
return the same token, signed with the private key from our ACME account credentials, in the
response body. This signed token is known as a
[key authorization](https://datatracker.ietf.org/doc/html/rfc8555#section-8.1).
Before we set the challenge to ready, we need to persist the challenge token and key authorization
somewhere, so we can serve it in response to ACME server requests. At Shuttle, we use an external
database for this, since there are many instances of our ACME client running at a given time,
behind a load balancer, and they all need to be able to complete any challenge. But in the interest
of keeping this example simple, we'll just store them in a `HashMap`.
To serve the challenge endpoint, we'll set up a simple Axum server, but you could use any framework
of your choosing, or even just a simple Hyper server if you want something bare-bones. We'll start
by creating some utility functions to set up our Axum server.
```rust
use axum::{
extract::{Path, State},
http::StatusCode,
routing::any,
Router,
};
use instant_acme::ChallengeType;
/// Set up a simple acme server to respond to http01 challenges.
pub fn acme_router(challenges: HashMap) -> Router {
Router::new()
.route(
"/.well-known/acme-challenge/{*token}",
any(http01_challenge),
)
.with_state(challenges)
}
/// Respond to HTTP-01 challenges by extracting the token from the path of the request, and then
/// using the token to look up the matching key authorization in our internal state.
pub async fn http01_challenge(
State(challenges): State>,
Path(token): Path,
) -> Result {
tracing::info!(%token, "received HTTP-01 ACME challenge");
if let Some(key_auth) = challenges.get(&token) {
Ok({
tracing::info!(%key_auth, "responding to ACME challenge");
key_auth.clone()
})
} else {
tracing::warn!(%token, "didn't find acme challenge");
Err(StatusCode::NOT_FOUND)
}
}
#[tokio::main]
async fn main() -> anyhow::Result<()> {
[...]
let challenge = authorization
.challenges
.iter()
.find(|c| c.r#type == ChallengeType::Http01)
.ok_or_else(|| anyhow::anyhow!("no http01 challenge found"))?;
let challenges = HashMap::from([(
challenge.token.clone(),
order.key_authorization(challenge).as_str().to_string(),
)]);
tracing::info!("challenges: {:?}", challenges);
// We use the utility function we created below to configure our Axum router.
let acme_router = acme_router(challenges);
// NOTE: when the ACME server sends the challenge request to your domain, it will always
// connect on port 80, which is specified in the standard.
// At Shuttle we have a load balancer in front of the ACME client, which listens for ACME
// requests on port 80, and forwards them to the challenge server running on a different port.
let address = "0.0.0.0:5002";
let listener = tokio::net::TcpListener::bind("0.0.0.0:5002").await.unwrap();
// Start the Axum server as a background task, so it's running while we complete the challenge
// in the next steps.
tokio::task::spawn(async move { axum::serve(listener, acme_router).await.unwrap() });
tracing::info!("serving HTTP-01 challenge server at: 0.0.0.0:5002");
}
```
### Initiate The HTTP-01 Challenge
Now that our HTTP-01 challenge server is up and running in the background, we can proceed with our
order. The next step is to communicate to the ACME server that we are ready to complete the
challenge.
```rust
use anyhow::{bail, Context};
use instant_acme::OrderStatus;
#[tokio::main]
async fn main() -> anyhow::Result<()> {
[...]
// Notify the ACME server that we are ready to complete the challenge.
order
.set_challenge_ready(&challenge.url)
.await
.context("failed to notify ACME server that challenge is ready")?;
// We now need to wait until the order reaches an end-state. We refresh the order in a loop,
// with exponential backoff, until the order is either ready or invalid (for example if our
// challenge server responded with the wrong key authorization).
let mut tries = 1u8;
let mut delay = Duration::from_millis(250);
loop {
tokio::time::sleep(delay).await;
let state = order.refresh().await.unwrap();
if let OrderStatus::Ready | OrderStatus::Invalid = state.status {
tracing::info!("order state: {:#?}", state);
break;
}
delay *= 2;
tries += 1;
if tries < 15 {
tracing::info!(?state, tries, "order is not ready, waiting {delay:?}");
} else {
tracing::error!(
tries,
"timed out before order reached ready state: {state:#?}"
);
bail!("timed out before order reached ready state");
}
}
let state = order.state();
if state.status != OrderStatus::Ready {
bail!("unexpected order status: {:?}", state.status);
}
tracing::info!(?state, "challenge completed");
```
### Requesting a certificate with a CSR
Now that the challenge is completed, we are ready to
[finalize the order](https://datatracker.ietf.org/doc/html/rfc8555#section-7.1.4) and request the
certificate. First, we'll need to create a
[certificate signing request](https://en.wikipedia.org/wiki/Certificate_signing_request) (CSR).
Creating the CSR is outside the scope of the `instant_acme` crate, so we'll need to use another
library for that, [`rcgen`](https://github.com/rustls/rcgen).
While requesting the certificate should be fast, it won't be ready immediately, so here again we
will poll until it's ready.
```rust
use anyhow::{bail, Context};
use rcgen::{CertificateParams, DistinguishedName, KeyPair};
#[tokio::main]
async fn main() -> anyhow::Result<()> {
[...]
// Create a CSR for our domain.
let mut params = CertificateParams::new(vec![domain.to_owned()])?;
params.distinguished_name = DistinguishedName::new();
let private_key = KeyPair::generate()?;
let signing_request = params.serialize_request(&private_key)?;
// DER encode the CSR and use it to request our certificate from the ACME server.
order
.finalize(signing_request.der())
.await
.context("failed to finalize order")?;
// Poll for certificate, do this for a few rounds.
let mut cert_chain_pem: Option = None;
let mut retries = 5;
while cert_chain_pem.is_none() && retries > 0 {
cert_chain_pem = order
.certificate()
.await
.context("failed to get the certificate for order")?;
retries -= 1;
tokio::time::sleep(Duration::from_secs(1)).await;
}
let Some(chain) = cert_chain_pem else {
bail!("failed to get certificate for order before timeout");
};
tracing::info!("certificate chain:\n\n{}", chain);
tracing::info!("private key:\n\n{}", private_key.serialize_pem());
Ok(())
}
```
And there we have it! A certificate we can serve for my-domain.com. At Shuttle, we store these
certificates in a database, then serve them in the TLS handler of our Pingora based proxy.
Note that the example in this article will fail if ran locally, since the HTTP-01 challenge server
has to be served on port 80 on the IP that the domain DNS record points to. If you want to test it
locally, you can use Pebble, a small and simple ACME test server. You can see an example of that,
and the full source code for this article, in the [repository](https://github.com/oddgrd/acme-article).
---
# Building a Discord Summarizer bot with DeepSeek, Rig & Rust
Source: https://www.shuttle.dev/blog/2025/01/29/discord-summarizer-deepseek-rig-rust
Date: 29 January 2025
Author: josh
Tags: rust, guide, ai, discord
Exploring real life use cases with AI, using DeepSeek and the Rig AI framework.
## Introduction
Whether you're a community manager or part of a collaborative team, staying on top of conversations can be challenging. What if you could automate the process and generate concise, Markdown-based summaries of your server's activity every day? That's exactly what we're going to build in this tutorial!
In this guide, we'll create a Discord bot that listens to your server, collects messages from the previous day, and generates a neatly formatted Markdown summary. The summary will highlight key points and group messages by topics and authors. This bot will save time, improve organisation, and make it easier to follow conversations. We'll also be using the new DeepSeek R1 model to generate our summaries with [Hyperbolic,](https://hyperbolic.xyz/) an AI cloud provider that provides GPU renting services as well as an AI inference API.
Interested in checking out the full example? Find it [here.](https://github.com/joshua-mo-143/discord-message-summarizer-bot)
## Pre-Requisites
Before we get started, you'll need to make sure you have the following installed:
- the Rust programming language
- The `cargo-shuttle` CLI tool (for deploying to Shuttle & project initialisation)
- You will also additionally need a Hyperbolic API key. To get one, follow the instructions below:
- You'll need to [make a Hyperbolic account](https://app.hyperbolic.xyz/) from the application.
- Once registered, navigate to the [Settings](https://app.hyperbolic.xyz/settings) page on the dashboard.
- You'll be able to view and copy your Hyperbolic API Key from there. Keep ahold of your API key as we'll be using it later.
- A Discord API key is also required. If you don't already have one, follow the instructions to get one (it's totally free!):
- Click the New Application button, name your application and click Create.
- Navigate to the Bot tab in the lefthand menu, and add a new bot.
- On the bot page click the Reset Token button to reveal your token. Keep ahold of this token as we'll be using it later.
- For the sake of this example, you also need to scroll down on the
bot page to the Message Content Intent section and enable that option.
- You will also need `sqlx-cli` installed (the SQLx CLI tool) which will allow you to easily manage SQL migrations versions.
## Getting Started
To get started, we will spin up a framework boilerplate that deploys a bot using the `serenity` Discord bot framework:
```bash
shuttle init --template serenity
```
This will create a template with the following:
- A `Bot` unit struct that has a basic `EventHandler` implementation
- A `main` function that sets up a `serenity` client for automatic deployment to Shuttle
You'll also notice that a `Secrets.toml` file has been created. We'll extend it to include the Hyperbolic API key & Discord we obtained before. Note that you will also need a Discord channel ID where you want your bot to send the reports to - you can select a channel by simply right clicking it and getting the channel ID.
```toml
# Secrets.toml
DISCORD_TOKEN = 'the contents of my discord token'
CHANNEL_ID = 'the ID of the Discord channel to send your reports to'
HYPERBOLIC_API_KEY = 'your hyperbolic API key'
```
### Adding crate dependencies
Before we continue, let's add our crate dependencies. You can add all the required dependencies by copying the one-liner below:
```bash
cargo add chrono rig-core serde-json shuttle-shared-db sqlx -F \
chrono/serde,shuttle-shared-db/sqlx,shuttle-shared-db/postgres,\
sqlx/runtime-tokio-rustls,sqlx/postgres,sqlx/chrono,sqlx/macros
```
Let's closely examine what our new dependencies are for:
- **rig-core:** The `rig` framework.
- **sqlx:** A library for working with SQL. We add the `runtime-tokio-rustls` and `postgres` features (both are mandatory), as well as the `macros` and `chrono` features for enabling usage with the `chrono` crate.
- **shuttle-shared-db:** A crate that allows provisioning of a Postgres database from Shuttle servers (and locally, Docker). We can allow it to output a connection pool from the Shuttle resource annotation
- **chrono:** A crate for dealing with time.
- **serde-json:** A crate for (de)serializing to and from JSON.
## Let's Build!
### Migrations
Before we do anything, we need to create our migration table. Let's create our first migration - we'll make it reversible:
```bash
sqlx migrate add -r init
```
This creates a folder called `migrations` in your project root and additionally creates an `up` and `down` file for creating and reversing migrations, respectively.
We'll want to store both received messages, as well as summaries:
```sql
-- Add up migration script here
create table if not exists messages (
id int generated always as identity primary key,
data jsonb not null,
created_at timestamptz default current_timestamp not null
);
create table if not exists summaries (
id int generated always as identity primary key,
summary varchar not null,
date date not null,
created_at timestamptz default current_timestamp not null
);
```
Next, we'll set up our `down` file which will reverse the migration. You should not need this in most cases, but in case you want to drop the table for whatever reason (e.g. during development or testing), you can do so:
```sql
-- Add down migration script here
drop table if exists messages;
drop table if exists summaries;
```
### Storing Messages
To store messages, we will upgrade our `Bot` struct (which acts as the event handler struct) to additionally include our `PgPool`. When we implement `EventHandler` for our struct, we will then be able to access the database pool to make insertion queries.
```rust
// main.rs
use sqlx::PgPool;
struct Bot {
pool: PgPool
}
// add convenience init method
impl Bot {
fn new(pool: PgPool) -> Self {
Self {
pool
}
}
}
```
Next, we will make it so that any and all messages created will be stored in our Postgres instance as a JSON object - we will adjust our `impl EventHandler for Bot` block to simply convert the message into a raw JSON string then store it.
```rust
// main.rs
use serenity::model::channel::Message;
use serenity::model::gateway::Ready;
use serenity::prelude::*;
#[async_trait]
impl EventHandler for Bot {
async fn message(&self, _: Context, msg: Message) {
// note we can basically garuantee this will be a JSON compatible
// object, so we can unwrap here while developing
let message = serde_json::to_string_pretty(&msg).unwrap();
sqlx::query("INSERT INTO messages (data) values ($1)")
.bind(message)
.execute(&self.pool)
.await
.unwrap();
}
async fn ready(&self, _: Context, ready: Ready) {
info!("{} is connected!", ready.user.name);
}
}
```
That's pretty much it for the Discord bot interactions at a basic level. Nothing else required! Note that this is a relatively naive implementation. If you wanted to improve this, a good way to do so would be to have some kind of durable message queueing to ensure that there is no information loss.
### Creating a Summarization Agent
This part is fortunately quite simple. For our summaries, we only need to implement a single AI agent that summarizes all the messages. We then return the result.
```rust
// llm.rs
use std::env;
use rig::completion::Prompt;
pub async fn summarize_messages(messages_json: String) -> Result> {
// Create OpenAI client
let client = rig::providers::hyperbolic::Client::new(
&env::var("HYPERBOLIC_API_KEY").expect("HYPERBOLIC_API_KEY not set"),
);
// Create agent with a single context prompt
let summarizer_agent = client
.agent("deepseek-ai/DeepSeek-R1")
.preamble("Your job is to summarize a list of Discord messages from a single day in JSON format.
The output should be in Markdown and is intended to provide a summary of important events and conversation topics from the day given.
If there are no messages, simply respond 'Nothing was discussed.'")
.build();
let result = summarizer_agent.prompt(&messages_json).await?;
Ok(result)
}
```
### Creating and sending summaries
Now for the fun part - creating and sending summaries (to a Discord channel of our choosing!). We'll split this into a couple of separate functions:
- One for generating the report itself (so that we can extend it to be used elsewhere other than the scheduled task that sends generated reports to a Discord channel)
- One for running a scheduled task (that carries out report generation & sending)
```rust
// main.rs
pub mod llm;
pub async fn generate_report(pool: &PgPool) -> Result> {
let date_yesterday = chrono::Utc::now().date_naive() - chrono::Days::new(1);
let res: Option =
sqlx::query_scalar("SELECT jsonb_agg(data) FROM messages WHERE created::date = $1")
.bind(date_yesterday)
.fetch_optional(pool)
.await?;
let Some(res) = res else {
return Err("There were no messages in the database :(".into());
};
let raw_json = serde_json::to_string_pretty(&res).unwrap();
let prompt_result = match llm::summarize_messages(raw_json).await {
Ok(res) => res,
Err(e) => {
return Err(
format!("Something went wrong while trying to summarize messages: {e}").into(),
)
}
};
if let Err(e) = sqlx::query("INSERT INTO summaries (summary, date) VALUES ($1, $2)")
.bind(&prompt_result)
.bind(date_yesterday)
.execute(pool)
.await
{
return Err(format!("Error ocurred while storing summary: {e}").into());
};
Ok(prompt_result)
}
```
The other half of this is creating our loop for automatically sending summaries. To ensure that the loop properly executes the task on time, we use `tokio::time::Interval` which is more accurate compared to simply just using the `tokio::time::sleep()` method.
```rust
// main.rs
use serenity::all::{ChannelId, Http};
pub async fn automated_summarized_messages(
channel_id: ChannelId,
token: String,
pool: PgPool,
) {
let http_client = Http::new(&token);
// here we wait 24 hours
let mut interval = tokio::time::interval(Duration::from_secs(86400));
loop {
// wait until the next tick
// we wait 24 hours here as there may be no messages in Discord
interval.tick().await;
// instead of returning an error here, we simply continue
// due to the error potentially not being related to the bot runtime
let report = match generate_report(&pool).await {
Ok(res) => res,
Err(e) => {
println!("{e}");
continue;
}
};
if let Err(e) = http_client.send_message(channel_id, Vec::new(), &report).await {
println!("Something went wrong while sending summary message: {e}");
};
}
}
```
### Hooking it all back up
The first time we need to do is to add our `Postgres` annotation from `shuttle-shared-db` - to do so, we simply add it as a function argument to our main function (shown as annotated by the runtime macro):
```rust
// main.rs
use shuttle_runtime::SecretStore;
#[shuttle_runtime::main]
async fn serenity(
#[shuttle_runtime::Secrets] secrets: SecretStore,
#[shuttle_shared_db::Postgres] pool: PgPool, // add annotation here
) -> shuttle_serenity::ShuttleSerenity {
sqlx::migrate!().run(&pool).await.expect("Couldn't run database migrations");
// code goes here
}
```
Running your program locally will now use Docker to provision a Postgres database. Additionally, when deployed the Shuttle servers will automatically provision a Postgres database for you using the shared cluster.
Note that there's a return type here - `ShuttleSerenity`. We don't need to run the Discord bot manually because the runtime does this automatically for us - instead, we return the Discord bot struct using `.into()` - this will be illustrated later on.
Next, we need to get our secrets from the `SecretStore` (i.e., our `Secrets.toml` file that we created earlier). We also need to parse our channel ID into a `u64` as this will then allow us to automatically convert it into a `serenity::all::ChannelId`, which we need to then use for sending messages to with a Discord HTTP client.
```rust
use anyhow::Context as _;
secrets.into_iter().for_each(|(key, val)| {
std::env::set_var(key, val);
});
// Get the discord token set in `Secrets.toml`
let token = std::env::var("DISCORD_TOKEN").context("'DISCORD_TOKEN' was not found")?;
let channel_id: ChannelId = std::env::var("CHANNEL_ID")
.context("'CHANNEL_ID' was not found")?
.parse::()
.context("Tried to convert CHANNEL_ID env var but the value is not a valid u64")?
.into();
```
Finally we will set up Discord bot and scheduled task, then return the Discord bot client, then return the bot (note that `ShuttleSerenity` implements `From` which is why we can use `.into()` here):
```rust
let intents = GatewayIntents::GUILD_MESSAGES
| GatewayIntents::MESSAGE_CONTENT;
let client = serenity::Client::builder(&token, intents)
.event_handler(Bot::new(pool.clone()))
.await
.expect("Err creating client");
tokio::spawn(async move {
automated_summarized_messages(channel_id, token, pool).await;
});
Ok(client.into())
```
## Deploying
Now that we've written all of the code, we can just use `shuttle deploy` and watch the magic happen!
Note that we're not using a web service framework - trying to reach the deployment URL will simply return with a 404.
## Finishing up
Thanks for reading! Hopefully you have found this useful. While AI assisted applications aren't quite ready to do the dishes yet, they can certainly be quite helpful in a number of ways.
---
# Setting up effective CI/CD for Rust projects - a short primer
Source: https://www.shuttle.dev/blog/2025/01/23/setup-rust-ci-cd
Date: 23 January 2025
Author: josh
Tags: rust, guide
Implement Continuous Integration & Continuous Development effectively in your Rust project.
## Introduction
The importance of a good CI/CD pipeline cannot go understated. The more you can automate in your deployment pipeline, the less work you have to do overall. That being said, it can be difficult to set up an effective CI/CD pipeline if it's your first time doing it. YAML files can be quite tricky to debug, and you can also additionally incur high costs from inefficient pipelines if you aren't careful.
That being said, let's explore how to create effective CI/CD through Github Actions, an easy to use CI runner.
## Fundamentals of a Rust CI/CD Workflow
The average Rust project might have the following things carried out in CI:
- Automatic usage of `clippy`, exiting the workflow if there are **any** warnings or errors
- Automatic usage of `fmt`, exiting the workflow if there is **any** diff
- Automatic testing
- Automatic website deployment
- Dependabot
Below is an example of a CI/CD workflow using YAML that you might find for a Rust project. For this file to be usable by Github Actions, it needs to be in the `.github/workflows` folder (relative to your project root). We'll call our file `workflow.yml` for the purpose of simplicity. Let's go through the steps:
- Our workflow will only run on a pull request to `main`. Before we merge to main we need to ensure that the code compiles on a pull request - once the code's been pushed to main, it's a bit too late to make any changes by then and we'll have to push another PR to fix it!
- We check out the code and install our required dependencies (meaning the Rust toolchain and `cargo-nextest`). Note that for external dependencies, using pure binary downloads is often far faster than trying to use `cargo install`.
- We then run all the required commands (`clippy`, `fmt` and `cargo nextest run`) and exit the workflow automatically if any of the 3 commands fail.
```yaml
# .github/workflows/workflow.yml
name: CI
on:
pull_request:
branches:
- main
jobs:
build-and-test:
runs-on: ubuntu-latest
steps:
# Checkout the repository
- name: Checkout code
uses: actions/checkout@v3
# Install Rust toolchain
- name: Install Rust
uses: actions-rs/toolchain@v1
with:
profile: minimal
toolchain: stable
override: true
#
- name: Install cargo-nextest
uses: taiki-e/install-action@cargo-nextest
# Run Clippy (linting)
- name: Run Clippy
run: cargo clippy --all-targets -- -D warnings
# Check code formatting
- name: Check formatting
run: cargo fmt --all --check
# Run tests with cargo-nextest
- name: Run Tests
run: cargo nextest run
```
## Speed up Rust CI/CD with sccache
In addition to the above tools, you can use `sccache` to speed up your builds. `sccache` is a tool designed to speed up compilations (like `cacche`) by utilising caching. It supports quite a few different backends like S3 which means you're able to use it in many locations - but it also means you can use it in Github Actions.
```yaml
name: CI
on:
pull_request:
branches:
- main
jobs:
build-and-test:
runs-on: ubuntu-latest
env:
SCCACHE_GHA_ENABLED: "true"
RUSTC_WRAPPER: "sccache"
steps:
# .. initialisation steps go up here
# run sccache
- name: Run sccache-cache
uses: mozilla-actions/sccache-action@v0.0.7
# run your cargo commands here
```
And now you're done! Interested in finding out more? Check out [the sccache Github readme](https://github.com/Mozilla-Actions/sccache-action?tab=readme-ov-file), which will have everything you need to know.
## Dependabot
Dependabot is a tool provided by Github to help you manage dependencies effectively. While Dependabot _itself_ is not a CI tool, it is a great complement for any CI/CD pipeline on Github. Without it, you will often otherwise having to spend time manually checking dependency versions.
You can set up Dependabot quickly and easily by adding it in your Github workflows like so (file should be in `# /.github/dependabot.yml`):
```yaml
# Please see the documentation for all configuration options:
#
version: 2
updates:
- package-ecosystem: "cargo"
directory: "/"
schedule:
interval: "weekly"
ignore:
# These are peer deps of Cargo and should not be automatically bumped
- dependency-name: "semver"
- dependency-name: "crates-io"
rebase-strategy: "disabled"
```
Once you've added it to version control, nothing else is required. When there are new dependencies, Dependabot will automatically create issues/PRs as required. You can also additonally customise your Dependabot config much further - which you can [find out more in the Github documentation.](https://docs.github.com/en/code-security/dependabot/working-with-dependabot/managing-pull-requests-for-dependency-updates)
## Releasing new library versions with CI
Let's face it, releasing new libraries is a lot of work. You need to manually add release notes and create a release on Github, you need to publish a new crate version on Github, you need to check for any breaking changes and ensure they're in the list... the list goes on.
Fortunately, there's a way to easily automate all of this. You can use [release-plz](https://github.com/release-plz/release-plz) to do all of it for you - when you're ready to go through with the update, simply merge the Release PR provided by `release-plz`.
## Using CI/CD with Shuttle
Of course, you can also use CI/CD with Shuttle. Check out [the deploy-action repo](https://github.com/shuttle-hq/deploy-action/tree/v2) where there is an easy-to-follow example on how to deploy Shuttle from your CI/CD pipeline rather than having to do it from the CLI.
```yaml
name: Shuttle Deploy
on:
push:
branches:
- main
workflow_dispatch:
jobs:
deploy:
runs-on: ubuntu-latest
steps:
- uses: shuttle-hq/deploy-action@v2
with:
shuttle-api-key: ${{ secrets.SHUTTLE_API_KEY }}
project-id: proj_0123456789
working-directory: "backend"
cargo-shuttle-version: "0.48.1"
extra-args: --allow-dirty --debug
secrets: |
MY_AWESOME_SECRET_1 = '${{ secrets.SECRET_1 }}'
MY_AWESOME_SECRET_2 = '${{ secrets.SECRET_2 }}'
```
## Finishing Up
Thanks for reading! Hopefully you have gotten a good idea of how you can improve the effectiveness of your workflow using Github Actions with Rust codebases.
---
# Supporting Web3: How WeaveVM Ships Rust Microservices with Shuttle
Source: https://www.shuttle.dev/blog/2025/01/17/shuttle-web3-weavevm
Date: 17 January 2025
Tags: rust, case-study
Learn about how Shuttle can support Web3 related Rust web services off-chain.
## Introduction
We're really excited by Web3.
There's great work being done by really smart people. The mainstream adoption of decentralized infrastructure is moving the world in a direction of transparency and fairness and censorship resistance.
Our Rustacean cousins in Web3 are spending time building robust protocols and reference implementations of validators which work and scale beautifully.
At the same time, the _auxilliary_ infrastructure such as indexers, DA layers, etc. which are deployed off chain are a different story.
Speaking to multiple Web3 teams, we've discovered that running these services reliably is an orthogonal skillset. While important, this also distracts them from their core mission.
This is the story of how [WeaveVM](https://www.wvm.dev/) solved this painpoint with Shuttle and why a Rust-focused PaaS fits like a glove.
## About WeaveVM
WeaveVM is building permanent data storage and high-throughput data availability for blockchain networks, settling 100k daily transactions and securing over $1.5B in total value across networks like Metis, Humanode, Avalanche and Dymension.
Integrated with a wide network of chains and data protocols, they needed auxilliary services deployed off-chain quickly and reliably - this is where Shuttle comes in.
## Before Shuttle
The WeaveVM team started with Heroku. Over time this grew into more of a headache than they asked for. Unnecessarily complex deployment flows, dependency mismatches, SSL certs were absorbing their limited and valuable time from doing what actually mattered.
"We were spending precious dev time on infrastructure instead of building features that actually mattered," the team shared. "Then we found Shuttle, and it won on every single DevOps point."
## Enter Shuttle
Moving to Shuttle was really quick for the WeaveVM team. Using Shuttle's annotation system on an existing service gave a migration time of less than 30 minutes (although your mileage may vary).
```rust
#[shuttle_runtime::main]
async fn rocket(
#[shuttle_shared_db::Postgres] pool: PgPool,
) -> shuttle_rocket::ShuttleRocket {
let state = MyState { pool };
let rocket = rocket::build()
.mount("/", routes![hello])
.manage(state);
Ok(rocket.into())
}
```
WeaveVM's CTO Rani and the team are Rust pros, so translating that expertise to infrastructure was natural and liberating. Databases, secrets management, SSL certificates - everything just worked out of the box. "Shuttle's nice DevX reduces the development and deployment time and lets us focus on the thing that matters: the code" Rani said.
## Looking at Today
Today, WeaveVM's backend team ships Rust microservices - APIs, ETL pipelines, cron jobs without breaking a sweat. Their backend services, which have been migrated to Rust, scale seamlessly, while the team can quickly and easily spin up new services and experiment freely. When they need support, they get it directly through Josh and our team on Discord, a nice contrast to layers of impersonal support bots.
## Help us help you
We're here to help! If what you've read sounds familiar sign up to Shuttle or reach out directly on [Discord](https://discord.gg/shuttle) or by email. Our team is excited to help you just deal with Rust and save you the headache of maintaining infrastructure.
Help us help you deliver Web3.
---
# The Emotional Appeal of Rust
Source: https://www.shuttle.dev/blog/2025/01/14/the-appeal-of-rust
Date: 14 January 2025
Author: antithesis
Tags: rust, opinion
What makes Rust emotionally appealing to its users?
My first encounter with Rust was seeing my new CTO literally nail a rusty gear onto the office wall. This was in 2021, the gear was the size of a plate, and in its center was a capital R. So the first thing I learned about Rust was that it's not like other programming languages. Those logos appear on t-shirts, and anonymous black backpacks. Nobody nails C++ to the wall (except maybe figuratively, on the internet).
The next thing I learned about Rust was that it's safe, in all these ways that earlier programming languages weren't. This caught my attention too, because the language was so raw, and so reflective of the roller coaster we get on with our first `hello world!`.
I think most of us have this deep-seated emotional arc in our relationship with programming. We started in software because writing code made things happen - because code is power[^1]. Then at some point between your first line of code and your reading of this essay you learn that power is actually terrifyingly complicated. You break a build. You introduce a bug that takes your team weeks to find. And then you have to deal with how that makes you feel, and by and large you're dealing with your feelings alone because coding is a solitary activity, and at moments like this it can easily feel like even the computer isn't on your side.[^2]
So when Rust comes along and offers you a helping hand, it's remarkable, because so few other languages do. Even if it sometimes feels like that helping hand is dragging you up a wall that's covered in broken glass, it's still better than plunging into the shark-filled moat below.
I'm talking, of course, about the compiler, and memory safety, probably the two most distinctive features of the language.
Memory safety issues mean you can't trust what you're seeing in your source code anymore. There's no program analysis you can perform to reason about your code anymore because you're breaking assumptions that your compiler has about the properties of your program, so there's a fundamental disagreement between what you see in the code and how the compiler will interpret it.
But these don't (generally) happen in Rust[^3], because the compiler checks all your assumptions about memory for you, by doing a static analysis of the code when it compiles. Working with the compiler has been described as "siege warfare," and not everyone loves having to speak the language of the machine, which sometimes makes you do things like itemize the variables in code you damn well know is safe.
Rust programmers call this "convincing the compiler,"[^4] and here Rust's architecture works in our favor. The compiler demands that our code is explicit, and the language provides opportunities to make it so. You can write unsafe code as long as you declare that you're doing so, and then wrap unsafe code in a safe wrapper. The type system both encourages you to modularize concerns and to declare exactly what functionality you want to expose. Make all the nullables you want, then declare how you're handling each and every case.
One senior engineer at Antithesis told me that he likes to treat the Rust compiler "as a friend" - one who won't let him do anything too bad, and from this perspective, you actually don't have a lot of friends when you're coding. C++ makes you check your own safety invariants, which is fine when you wrote the entire codebase, and less fine when you're Microsoft. Javascript will happily run code with type mismatches and nulls, with a well-defined runtime behavior of crashing. That Rust provides such guardrails at all is kind of a novelty.
So I'm inviting you to consider your relationship with this activity on which (I assume) you spend a great deal of your time. Programming might be a mostly rational exercise, but it's also a thing humans do, and humans are emotional creatures. I think Rust works for people not just because it works (on a technical level), but because it - and I know this phrase will be controversial - makes us feel safe as we build our worlds at the keyboard.
In that light, it's unsurprising that so much of what's written about Rust has this sense of "oh my god we finally fixed programming." We've all been cut by the rough edges of our programming language, which are old and jagged and vicious. And like everything else about computing, they're our responsibility. They're not physical phenomena. We put them there. And we put them there because safety, flexibility, and performance are an iron triangle, and giving up some safety meant we could build bigger or better.
Remember, the roller coaster has ups as well as downs. There are days when coding is actually fun - and writing code is fun because it makes things happen.
If you're writing Rust, you're probably not just doing so because you're a fan of the language, but because you actually need it for some reason. You're writing something that needs to be fast, distributed, reliable. Something that could be very very big. Rust can do all that, because in addition to being safe, it's very, very fast.
We started working with distributed systems for much the same reason - they let us build bigger and better than single systems did.[^5] But with multiple processors came multiple layers of complexity. Our environments and architectures became much more complex - we started having to worry about network faults, timing faults, and data races.
And here's the thing about distributed environments. They're almost inimical to the philosophy that makes Rust safe.
Explicitness is a key part of how Rust builds safety in your code, but there's no way to give your program an explicit understanding of the production environment. The environment, with all its rough edges, implicitly shapes how your code will run.
The Rust compiler in a sense functions as a test for your program, and most tests, the compiler included, imply perfection in the runtime environment. What else could it do? The machine only knows what it knows. The Rust compiler may be one of the best of its kind, but it isn't going to check your business logic or the resilience of your program in the face of the kind of faults it will encounter in production. The most important thing to be aware of with any piece of safety equipment is that safety has its limits. You need to know what the compiler can't catch.
But what if you could know that your code is actually safe in all those ways too? Not just memory-safe but actually reliable? What would you build?
You've probably worked on something that you wouldn't have tackled except in Rust, because the compiler gave you confidence. What would coding feel like if that confidence extended to every dimension of your code?
At Antithesis, we hear from customers about all kinds of projects that they wouldn't have tackled without the sense of safety we provide - complex, massively multi-threaded systems, rewrites that pay off years of tech debt, building new database systems from scratch - the truth is, safety unleashes ambition. You dream bigger if you know there's something catching your mistakes.
If you'd like to know more about what it's like to combine Antithesis with the Shuttle framework, you can [try this out today.](https://antithesis.com/contact/) Or, to see what we just built, using the combination of Rust and Antithesis testing, [come see us at the Monsterscale Summit online,](https://www.scylladb.com/monster-scale-summit/#richard-hart) this March.
[^1]: If you're very lucky, maybe you've held on to some of that sensation, through the interviews and the meetings and the code reviews and Jira and churn and managers who want to know what you do by the hour. I hope you have.
[^2]: I mean, it isn't. It's a machine. But you probably know what I mean.
[^3]: Safe Rust, at least. I know it's technically possible for this to happen. But it's rare to see this happen in everyday use, rare enough that Rust's reputation for memory safety is well deserved.
[^4]: One interesting thing about this is that you're usually compiling soon after you originally wrote the code, so you're likely to remember exactly what you were trying to do, even if you don't know exactly what you did wrong. Context is a wonderful thing.
[^5]: I know this isn't strictly true, but "the project won't fit on a single box" is probably the most common reason.
---
# Building an arXiv Agent with Rig & Rust
Source: https://www.shuttle.dev/blog/2025/01/08/arxiv-rig-rust
Date: 8 January 2025
Author: josh
Tags: tutorial, ai, rust
Learn about using the Rig LLM framework to be able to create AI agents for assisted research via arXiv.
Hi there! In this tutorial we're going to be using the Rig AI framework to create an AI agent for helping you learn by suggesting research papers based on a given subject. We're also going to use Shuttle to deploy it on the web so that other people can try it out!
Interested in just looking at the code? [Check out the GitHub repository.](https://github.com/0xPlaygrounds/rig-arxiv-agent-example/tree/main/shuttle)
## Why Rig?
Rig (by [Playgrounds](https://playgrounds.network/), who also additionally maintains [arc.fun](https://arc.fun)) is a new up-and-coming Rust framework designed to make AI agent creation as easy as possible. It can currently create agentic pipelines (ie. pipelines that can execute a number of prompts LLM-assisted steps), integrate RAG with AI agents as well as exposing an API that you can use to create your own tools.
The framework itself is growing quite rapidly with the maintainer team using it in production, so it will be receiving updates for quite some time! They're also holding an event called [the ARC Handshake](https://www.arc.fun/handshake), which will be a showcase of AI agents built using Rig.
## Pre-requisites
Before we start, you'll want to ensure you have the Rust programming language installed and additionally an OpenAI API token. If you don't have one already, you will need to sign in and [obtain an API key from the dashboard](https://platform.openai.com/settings/organization/general) as this will be required to make it work.
You'll also want the `cargo-shuttle` crate installed (our CLI) - [check out our installation instructions for more info.](https://docs.shuttle.dev/getting-started/installation)
## Let's get building!
If you haven't already, don't forget to create a new Shuttle project via [cargo-shuttle](https://docs.shuttle.dev/getting-started/installation):
```bash
shuttle init --template axum
```
Once you've followed the prompt and it's set up, we'll need to add our required dependencies to build the project:
```bash
cargo add reqwest serde serde-json anyhow thiserror quick-xml rig-core \
urlencoding tracing -F serde/derive,quick-xml/serialize
```
## Creating our Rig AI agent
The first step will be to create our AI agent. We can do this by creating a tool that will be able to send a prompt to a model (or in this case OpenAI), as well as do some functionality when called.
### Setup
The arXiv export endpoint (`http://export.arxiv.org/api/query`) takes a few different query parameters that are relevant to us:
- `search_query` (The actual search query we want to search for)
- `max` (maximum number of papers we want in the result)
Before we write the implementation block, let's declare the relevant structs we want. We want one for holding paper results, one for search arguments and one for the tool itself.
```rust
// Struct to hold paper metadata
#[derive(Debug, serde::Deserialize, serde::Serialize)]
pub struct Paper {
pub title: String,
pub authors: Vec,
pub abstract_text: String,
pub url: String,
pub categories: Vec,
}
impl Paper {
fn new() -> Self {
Self {
title: String::new(),
authors: Vec::new(),
abstract_text: String::new(),
url: String::new(),
categories: Vec::new(),
}
}
}
#[derive(serde::Deserialize)]
pub struct SearchArgs {
query: String,
max_results: Option,
}
// Tool to search for papers
#[derive(serde::Deserialize, serde::Serialize)]
pub struct ArxivSearchTool;
```
### Error Handling
While the AI agent is carrying out work, there are many different types of errors it can get. We should aim to represent these by using an enum. We additionally enhance our error type by implementing `thiserror::Error` (requiring `Debug`), which allows us to easily derive `From` for our new error type.
```rust
#[derive(Debug, thiserror::Error)]
pub enum ArxivError {
#[error("Network error: {0}")]
Network(#[from] reqwest::Error),
#[error("XML parsing error: {0}")]
XmlParsing(#[from] quick_xml::Error),
#[error("No results found")]
NoResults,
#[error("UTF-8 decoding error: {0}")]
Utf8Error(#[from] std::str::Utf8Error),
}
```
By doing this, a couple of cool things happen:
- It enables use of the `?` operator which increases readability and allows error propagation up the call stack
- Makes it obvious why and/or how something has failed (we can check the enum variant)
### Rig Tool Definitions
Next, we want to write the implementation block. It requires us to provide functionality for two methods - `definition()` which provides the tool definition and prompting for the model, as well as `call()` which is the actual functionality for the tool.
```rust
const ARXIV_URL: &str = "http://export.arxiv.org/api/query";
impl Tool for ArxivSearchTool {
const NAME: &'static str = "search_arxiv";
type Error = ArxivError;
type Args = SearchArgs;
type Output = Vec;
async fn definition(&self, _prompt: String) -> ToolDefinition {
ToolDefinition {
name: "search_arxiv".to_string(),
description: "Search for academic papers on arXiv".to_string(),
parameters: json!({
"type": "object",
"properties": {
"query": {
"type": "string",
"description": "Search query for papers"
},
"max_results": {
"type": "integer",
"description": "Maximum number of results to return (default: 5)"
}
},
"required": ["query"]
}),
}
}
async fn call(&self, args: Self::Args) -> Result {
let max_results = args.max_results.unwrap_or(5);
let client = reqwest::Client::new();
let response = client
.get(ARXIV_URL)
.query(&[
("search_query", format!("all:{}", args.query)),
("start", 0.to_string()),
("max_results", max_results.to_string()),
])
.send()
.await?
.text()
.await?;
parse_arxiv_response(&response) // not implemented yet!
}
}
```
Note that the tool is simply a tool that can be called by the model - it can either be added to a given Rig prompt by itself, or it can be added to a toolset with other tools to provide a comprehensive user experience.
### Parsing the arXiv response
Next, we need parse the response from arXiv. The actual response format is in XML - this is what a typical entry looks like:
```xml
http://arxiv.org/abs/2407.11861v12024-07-16T15:48:36Z2024-07-16T15:48:36ZWhat Makes a Meme a Meme? Identifying Memes for Memetics-Aware Dataset CreationMuzhaffar HazmanSusan McKeeverJosephine GriffithAccepted for Publication at AAAI-ICWSM 2025
```
In order to parse it, we will use the `quickxml` crate which offers good performance while still being relatively easy to use.
To ensure codebase readability, we will create a struct that will act as our parser and hold the parser state in it:
```rust
#[derive(Default)]
struct ArxivParser<'a> {
papers: Vec,
current_paper: Option,
current_authors: Vec,
current_categories: Vec,
in_entry: bool,
current_field: Option<&'a str>,
}
```
We will implement several methods on this struct:
- Methods for handling different types of XML events
- A public method for parsing the whole text
To start with, we'll create methods for handling the start of an XML tag as well as any text that is contained within the tag:
```rust
impl<'a> ArxivParser<'a> {
fn parse_start_event(&mut self, event: &BytesStart) {
match event.name().as_ref() {
// if the tag is "entry", this means we're at the start of a new xml block
// so we can clear related variables and start anew
b"entry" => {
self.in_entry = true;
self.current_paper = Some(Paper::new());
self.current_authors.clear();
self.current_categories.clear();
}
// otherwise, change the parsing state
b"title" if self.in_entry => self.current_field = Some("title"),
b"author" if self.in_entry => self.current_field = Some("author"),
b"summary" if self.in_entry => self.current_field = Some("abstract"),
b"link" if self.in_entry => self.current_field = Some("link"),
b"category" if self.in_entry => self.current_field = Some("category"),
_ => (),
};
}
fn parse_text_event(&mut self, event: &BytesText) -> Result<(), ArxivError>
// if there's no current paper, just don't return anything
let Some(paper) = self.current_paper.as_mut() else {
return Ok(());
};
// otherwise, attempt to get the text and fill in the relevant field
let text = str::from_utf8(event.as_ref())?.to_owned();
match self.current_field {
Some("title") => paper.title = text,
Some("author") => self.current_authors.push(text),
Some("abstract") => paper.abstract_text = text,
_ => (),
}
Ok(())
}
}
```
Before we continue, we need to create a small function to be able to convert the links we get from parsing an `arXiv` XML entry to be able to return the PDF response. See below where we replace `arxiv.org/abs` with `arxiv.org/pdf`:
```rust
fn convert_pdf_url(url: &str) -> String {
if url.contains("arxiv.org/abs/") {
// Convert abstract URL to PDF URL
url.replace("arxiv.org/abs/", "arxiv.org/pdf/")
.replace("http://", "https://")
+ ".pdf"
} else if url.contains("arxiv.org/pdf/") {
// Ensure PDF URL uses HTTPS
url.replace("http://", "https://")
} else {
// Fallback for other URLs
url.replace("http://", "https://")
}
}
```
Next, we want to parse empty XML elements. If the XML element is a Link or Category, we attempt to parse them like below and add the relevant parts to the parser state:
```rust
impl<'a> ArxivParser<'a> {
// .. other methods here
fn parse_empty_event(&mut self, event: &BytesStart) -> Result<(), ArxivError> {
// if we're not in an entry, just don't do anything
if !self.in_entry {
return Ok(());
}
// if the element is a link, convert the URL to the relevant format
// and add the URL to the paper
if event.name().as_ref() == b"link" {
if let Some(paper) = self.current_paper.as_mut() {
for attr in event.attributes().flatten() {
if attr.key.as_ref() == b"href" {
let url = str::from_utf8(&attr.value)?;
// Convert to HTTPS and ensure PDF URL
let secure_url = convert_pdf_url(url);
secure_url.clone_into(&mut paper.url);
}
}
}
}
// if the element is a Category, push the category terms
// into the parser's list of current categories
if event.name().as_ref() == b"category" {
for attr in event.attributes().flatten() {
if attr.key.as_ref() == b"term" {
self.current_categories
.push(str::from_utf8(&attr.value)?.to_owned());
}
}
}
Ok(())
}
```
We also need to ensure that we are correctly resetting the parser state when we reach the end of an element:
- If we reach the end of an entry, we need to push our current `Paper` to the list of papers being generated by the parser
- If we reach the end of another element, we just reset the `current_field` field as there is nothing left to parse within the given element.
```rust
impl<'a> ArxivParser<'a> {
// .. other methods
fn parse_end_event(&mut self, event: &BytesEnd) -> Result<(), ArxivError> {
// this is an end event - if the end tag is for an entry
// add the current paper to the list of papers
match event.name().as_ref() {
b"entry" => {
if let Some(mut paper) = self.current_paper.take() {
paper.authors.clone_from(&self.current_authors);
paper.categories.clone_from(&self.current_categories);
self.papers.push(paper);
}
self.in_entry = false;
}
// else, just change the currently parsed field to None
// as there is now nothing to parse
b"title" | b"author" | b"summary" | b"link" | b"category" => {
self.current_field = None;
}
_ => (),
}
Ok(())
}
}
```
Finally, we need to write our method for parsing the whole response. This function simply loops until the end of the XML file has been reached (an `Event::Eof` has been reached). If there's no papers that have been parsed (no results were returned), we will return an error.
```rust
impl<'a> ArxivParser<'a> {
// .. other methods
fn parse_response(&mut self, input: &str) -> Result, ArxivError> {
let mut reader = Reader::from_str(input);
reader.trim_text(true);
let mut buf = Vec::new();
loop {
match reader.read_event_into(&mut buf) {
Ok(Event::Start(ref e)) => self.parse_start_event(e),
Ok(Event::Text(ref e)) => self.parse_text_event(e)?,
Ok(Event::Empty(ref e)) => self.parse_empty_event(e)?,
Ok(Event::End(ref e)) => self.parse_end_event(e)?,
// EoF means end of file - we can stop trying to parse here
Ok(Event::Eof) => break,
Err(e) => return Err(ArxivError::XmlParsing(e)),
_ => (),
}
}
if self.papers.is_empty() {
return Err(ArxivError::NoResults);
}
Ok(self.papers.clone())
}
}
```
Now we can move onto writing our web service!
## Writing our Rust web service
In terms of application code for the web service itself, there are a few things:
- Setting up application state
- Setting up endpoints
- Serving a frontend (of our choice)
### Setting up application state
We can define the application state as a struct that holds our OpenAI client. Note that it's required to derive Clone as application state is shared over many requests, hence the Clone trait requirement (as it guarantees this behaviour).
```rust
#[derive(Clone)]
struct AppState {
openai_client: openai::Client,
}
```
### Error handling
Before we implement our endpoint, let's again take a minute to consider error handling. We want error handling to be as idiomatic as possible - and we also use `anyhow::Error` for a large majority of our errors as it's easy to use. Therefore, we should implement `From>` for our application error. We also additionally want to implement `axum::response::IntoResponse` for our error type as this allows the type to be used as part of a return type signature in an Axum function handler.
```rust
use axum::response::IntoResponse;
struct AppError(anyhow::Error);
impl IntoResponse for AppError {
fn into_response(self) -> Response {
(
axum::http::StatusCode::INTERNAL_SERVER_ERROR,
format!("Something went wrong: {}", self.0),
)
.into_response()
}
}
impl From for AppError
where
E: Into,
{
fn from(err: E) -> Self {
Self(err.into())
}
}
```
### Endpoints
There is only one single endpoint we need to write - the handler for receiving requests about papers to search and then carrying out the required work. The code snippet below is a relatively simple - we grab the query, we create an AI agent that uses GPT-4 and add some additional pre-amble (extra context) as well as the original prompt as part of the query. We then deserialize the resulting string and return a HTML response.
```rust
use serde::Deserialize;
// here we create a struct that we can use as the required request body shape
#[derive(Deserialize)]
struct SearchRequest {
query: String,
}
async fn search_papers(
State(state): State,
Json(request): Json,
) -> Result {
let paper_agent = state.openai_client
.agent(GPT_4)
.preamble(
"You are a helpful research assistant that can search and analyze academic papers from arXiv. \
When asked about a research topic, use the search_arxiv tool to find relevant papers and \
return only the raw JSON response from the tool."
)
.tool(ArxivSearchTool)
.build();
let response = paper_agent
.prompt(&request.query)
.await?;
// return the response as HTML
// note that if you want to return just a JSON response
// you can return `Ok(axum::Json(papers))`
let papers: Vec = serde_json::from_str(&response)?;
let html = tools::format_papers_as_html(&papers)?; // see below!
Ok(Html(html))
}
```
### Frontend
While we won't dive into writing the frontend in this article, you can [have a look at the HTML files yourself](https://github.com/0xPlaygrounds/rig-arxiv-agent-example/tree/main/shuttle/static) and copy them in (we use a folder called `static`, which is in the project root).
You'll need to create a handler to serve it:
```rust
use axum::response::Html;
// Handler for serving the static index.html
async fn serve_index() -> impl IntoResponse {
Html(include_str!("../static/index.html"))
}
```
We also additionally return the table of papers (from our API endpoint) as HTML. The following function is used to combine HTML templating with the papers we've sent through our AI agent to generate a result:
```rust
// HTML formatting function for papers
pub fn format_papers_as_html(papers: &[Paper]) -> Result> {
let tpl = std::fs::read_to_string("static/table.html")?;
let mut context = tera::Context::new();
context.insert("papers", papers);
let result = tera::Tera::one_off(&tpl, &context, true)?;
Ok(result)
}
```
### Putting it all together
Next, we'll set up our main function. We'll need to add the Secrets annotation (see below) to our function parameters, as well as adding a `CorsLayer` and our additional routes.
```rust
#[shuttle_runtime::main]
async fn axum(
// this annotation provides our secrets from Secrets.toml
#[shuttle_runtime::Secrets] secrets: SecretStore,
) -> shuttle_axum::ShuttleAxum {
// Initialize OpenAI client from secrets
let openai_key = secrets
.get("OPENAI_API_KEY")
.context("OPENAI_API_KEY secret not found")?;
let openai_client = openai::Client::new(&openai_key);
// Create shared state
let state = AppState { openai_client };
// Set up CORS
let cors = CorsLayer::new()
.allow_origin(Any)
.allow_methods([axum::http::Method::GET, axum::http::Method::POST])
.allow_headers(Any);
// Create router
let router = Router::new()
.route("/", get(serve_index))
.route("/api/search", post(search_papers))
.layer(cors)
.with_state(state);
Ok(router.into())
}
```
## Deploying
If you've added any frontend assets, make sure you add them to a `Shuttle.toml` file in your root folder (this will allow the frontend templates folder to be included in deployment):
```toml
[build]
assets = ["/*"]
```
If you've followed this tutorial from start to finish, the folder name should be `static`. We add `/*` at the end to signify that we want to include the whole directory and all files inside it.
To deploy, all you need to do is write `shuttle deploy` into the terminal and watch the magic happen! If you'd like to run this locally, simply run `shuttle run` then visit `localhost:8000`.
## Finishing up
Thanks for reading! Hopefully this article has increased your understanding of how to implement your own AI agent using the Rig AI framework, as well as writing a web service with a frontend.
Further reading:
- [Building agentic RAG with Qdrant & Rust](https://www.shuttle.dev/blog/2024/05/23/building-agentic-rag-rust-qdrant)
- [Get Started with Logging in Rust](https://www.shuttle.dev/blog/2023/09/20/logging-in-rust)
- [Get Started with Axum](https://www.shuttle.dev/blog/2023/12/06/using-axum-rust)
---
# Rethinking Cloud Pricing
Source: https://www.shuttle.dev/blog/2024/12/21/rethinking-cloud-pricing
Date: 21 December 2024
Author: nodar
Tags: shuttle, announcement
Learn about Shuttle's upcoming price changes and our thoughts on the current state of cloud pricing
Have you ever noticed that cloud pricing is like booking a budget flight—the ticket looks cheap at first, but by the time you've paid for luggage, a seat, and breathing room, it's a first-class bill? Pricing shouldn't come with hidden fees or surprise add-ons, yet we've accepted that as a norm in our cloud bills.
Let's talk about this—not just the numbers but the philosophy behind all this and how we do things differently at Shuttle. We're not just simplifying cloud development—we're making it joyful. That starts with pricing which you can actually understand.
## The Cloud Pricing Problem
Have you ever tried deciphering a cloud service bill? What exactly are you paying for? Compute? Storage? Egress? "Mystery charges"? And just when you think you've cracked the code, surprise! Another line item shows up for a service you didn't even know existed.
Let's take a familiar scenario:
You're spinning up a project. You pick a cloud provider, and after 40 minutes of decision fatigue, you've chosen a virtual server. But what size? What region? Reserved instances? And wait, what's an Availability Zone? Before you've written a single line of code, you're knee-deep in decision paralysis.
Now, imagine you're a startup. Infrastructure decisions multiply, DevOps becomes a bottleneck, and your bills? They look more like a Jackson Pollock painting than an itemized list.

> Pictured: an actual cloud startup bill
The complexity in cloud pricing exists because it reflects the vast array of services, configurations, and use cases cloud providers cater to. They aim to be everything to everyone—offering granular control over resources like compute, storage, and networking—while charging for every option and optimization along the way. This à la carte approach maximizes flexibility but also makes pricing opaque, as the true costs of running an application depend on a web of interdependent factors most developers don't have the time—or expertise—to untangle.
We get it. Cloud pricing is too complex, too opaque, and frankly, it's sucking the joy out of development. That's where we come in.
## Our Pricing Philosophy: Value Over Complexity
At Shuttle, we believe pricing shouldn't feel like calculus. It should be:
1. **Simple**: You know what you're paying for.
2. **Transparent**: No hidden fees, no cryptic bills.
3. **Focused on Developer Experience**: You're not just paying for infrastructure; you're investing in a smoother, faster, more joyful path to production.
Here's the deal: Cloud infrastructure should be a commodity. The magic happens in the moments between provisioning a server and pushing a bug-free feature to production. That's what Shuttle is all about—turning "I need to deploy" into "It's live!"
## The Future: Smarter, Predictable Pricing
We're dreaming big. Imagine a world where every deployment comes with a cost estimate. Thinking of scaling your app? You'll know the cost _before_ you confirm. Deploying a new feature? Get cost predictions down to the commit level.
In the future, cloud pricing won't just be simple—it'll be smart. We're exploring tools that integrate into your workflow, like combining commit based pricing and predictive pricing models to help you make informed decisions and avoid surprises.
## What We're Building Today
In the last few months at Shuttle, we completely overhauled the platform. It's now scalable, secure, robust, and ready for _production_ use cases.
The production readiness comes with new tiers, which are going live in 2025, which in turn results in a pricing model that is simpler and redesigned from the ground up. We've worked a ton on digesting the complexity, so you only get simplicity, and we're very excited to share our work with you soon.
That said, this is just another step, and as Shuttle keeps evolving, so will our pricing - to better serve you.
### The Community Tier
Still free. Still awesome. Perfect place to start and experiment with Shuttle, exploring Rust, or building that side project you've been dreaming about. Some minor tweaks coming and even clearer picture of what's included.
### The _New_ Pro Tier
This is for those looking for a "production" level experience. A pricing model that separates raw infrastructure costs from the developer experience we provide. Yes, we still add a small margin to the basic infra cost—it helps us build the tools, maintain the platform, and provide the support that turns "ugh, DevOps" into "ah, this is nice."
Here's what to expect:
- Simple and transparent infrastructure costs.
- Features that enhance production workflows—monitoring, observability, and priority support.
- A pricing structure that grows with you, whether you're a solo developer or a scaling team.
### The Team and Enterprise Tiers
For teams that need tailored support, we're working on options that scale with your ambitions. Dedicated onboarding, BYOC (Bring Your Own Cloud), features that enhance collaboration on more complex projects and flexible pricing for organizations that want to leverage Shuttle's simplicity without overhauling their existing setup.
## What's Next?
We're listening. Every feature, every tier, every decision is shaped by your feedback. So, tell us—what do you need? What's working? What's not?
Let's build a cloud platform (and pricing model) that developers actually love. Click [here](https://shuttlerust.typeform.com/to/awqLE9sL) to share your thoughts or sign up for early access to our Pro Tier.
---
# Setting up a Status Page with BetterStack
Source: https://www.shuttle.dev/blog/2024/12/20/set-up-status-page-betterstack
Date: 20 December 2024
Author: josh
Tags: betterstack, tutorial, guide, observability
Learn about best practices and improving your observability by creating a status page with BetterStack
## Introduction
Observability forms a huge part of being able to debug and resolve production incidents quickly. One way to improve observability is application monitoring and using telemetry to send your logs to an observability backend that also allows you view and analyse your logs. BetterStack (formerly known as Logtail) is a great way to do this, as they offer both a package for simple application monitoring and telemetry.
In this tutorial, we'll get into how you can add a status page for your web service using BetterStack, which by default supports status history, incident reporting and maintenance notices:
## Why use status pages at all?
While status pages are a commonly used solution to improve user experience, it's also important to talk about _why_ you should set up a status page. Status pages are a commonly used convention by a lot of different types of companies and although the reasons may seem relatively obvious, there are benefits for any company with a website to set up a status page for your users.
Although companies and professional teams often additionally opt for an internal status page (for internal services), we will primarily be discussing external-facing status pages below.
### Transparency builds trust
Not everyone is building a critical service with high availability requirements. That being said however, giving your users the ability to check themselves whether your service is either online or offline is a great way to build trust with them. By not hiding any of the metrics, it allows the user to trust that the company is handling the situation properly rather than doing everything behind closed doors and totally controlling the narrative.
### Spend less time answering user questions
Similarly, once user trust has been built they may more inclined to simply wait until the outage is over rather than creating a new help ticket. This means that overall, it should result in less questions needing to be answered regarding service availability.
## Setting up a status page with BetterStack
### Set up Status Monitoring
For the most part, application monitoring with BetterStack is quite easy. Once you've signed into your account (and finished the onboarding), you'll need to make sure you're on the "Uptime" section and then click on "Create monitor" (see below):
Next, you'll be brought to this menu. There's a drop-down list you can use to select different kinds of events for what should trigger a notification (non-exhaustive list below):
- URL becomes unavailable
- URL doesn't contain keyword
- URL contains keyword
- URL returns a status other than a given HTTP status
- Host doesn't respond to ping
You can also see that we've used [`https://shuttle.dev`](https://shuttle.dev) as the URL below - you can use whatever URL you want here, but if you have a Shuttle project in mind that you need to monitor, add the URL in here! You may want to dedicate a specific health check route for this - it's common convention to use `/healthz` or `/health` for this.
Once done, you should get to a menu that looks like image below. Now whenever your web service goes down, BetterStack should automatically let you know through email (or another method, if you're on one of the paid tiers) when the alert gets triggered.
### Setting up a status page
Now for the easy part! Head over to the Status Page tab then select "Create status page" like below.
Next, you should be greeted by a series of tabs with an initial Settings menu. Fill it out, then proceed to the Structure tab where we'll be adding our monitor that we created from earlier. If you click "Search to add resources", you'll be able to search for your monitor from there and add it in. Note that you can add an explanation as well as the widget type if you want to experiment.
Once done, you should now be able to head over to your status page and see it in action from the Monitors menu!
## Best practices for status pages
### Use a subdomain for the status page
This is an easy one to get right, but an important one nonetheless. If you're running a web service in production and have users, your users being able to check service uptime themselves can improve user experience significantly during downtime.
Typically, the subdomain used would be `status`. So in our example we would use `status.shuttle.dev` as the subdomain.
### Ensure coverage of your whole service
Status pages are great because they ensure that at least _one_ part (typically the health check route) is available form your status page. However, this does not guarantee a high degree of availability over your whole service - availability here meaning whether or not your service returns `2xx` or a `5xx` code). In this case, you likely want to use BetterStack's Playwright monitors to be able to use much more custom scenarios. By setting the What to Monitor option to `Playwright scenario fails`, we can now use the `playwright` JavaScript library to be able to set up tests! An example can be found below:
```rust
const { test, expect } = require('@playwright/test');
test('mobile page contains Sign up', async ({ page }) => {
await page.setViewportSize({ width: 360, height: 640 });
await page.goto('https://betterstack.com/');
const pageContent = await page.textContent('body');
expect(pageContent).toContain('Sign up');
});
```
While this might be something you might not want to put on a user-facing status page, it is a great way to protect yourself from regressions and breaking code changes. The [Playwright codegen tool](https://playwright.dev/docs/codegen) is a great way to spin some tests up quickly.
### Status pages & health checks aren't a full view of observability
Status pages based on external monitoring probes or health checks do not provide a full view of observability as they only represent a small sample of the total traffic to your service. Monitoring probes are similar to network pings, answering the question "is the service reachable?" Different types of metrics and application monitoring, such as total traffic, errors, response latency and resource usage, are required to get a complete picture of your service health. However, monitoring probes are an excellent and essential first line of defence, especially when hosted externally because the uptime of the monitoring tool is not correlated to the uptime of the service.
### Status pages cannot replace customer service
While status pages are helpful, they should not be the final answer to user-facing observability improvements. Particularly if your users are building a business on top of your platform, they should also receive notifications through proper channels for severe outages. This ensures a clear, professional line of communication with your customers which in most cases should improve customer service.
As a first step for this, a good communication channel is typically wherever your users are - be it Discord, Slack or Telegram (or even on X!). Email is also additionally another good channel to use as even when your most critical users are not on the same social media platforms you're on, there is an extremely high chance they have an email address you can send to.
### Use honest, concise language for incident reports
It might seem a little bit daunting to be completely honest about what went wrong in an incident. That being said, it is important to be honest and use concise language in incident reports as it is a good way to enforce the transparency aspect of a status page and potentially reap reputational benefits. It's also extremely important that the post mortems are also blameless: while a single person may have triggered it, the root cause is typically always systemic and it's important to keep this in mind. It also looks somewhat unprofessional to place the blame on a single person and can cause a witch hunt.
Understanding what exactly went wrong and communicating it publicly as well as how to fix it for the future is often much more important than hiding it, causing reputational risk. Often while incidents can seem huge at the time, eventually enough time passes that they become learning experiences and can be good educational material for the future members of your team.
## Finishing up
Thanks for reading! As you can see, BetterStack can significantly improve multiple facets of observability within your application, and is extremely helpful to have.
Read more:
- [Sending your logs to Datadog with Rust](https://www.shuttle.dev/blog/2024/03/27/datadog-rust)
- [Using OpenTelemetry with Rust](https://www.shuttle.dev/blog/2024/04/10/using-opentelemetry-rust)
- [Getting started with the tracing libraries](https://www.shuttle.dev/blog/2024/01/09/getting-started-tracing-rust)
---
# The Essence of Templating with Tera
Source: https://www.shuttle.dev/blog/2024/11/29/the-essence-of-templating-with-tera
Date: 29 November 2024
Author: jeff
Tags: rust, html-templating, frontend
How to get started with Shuttle and the Tera Crate
### Introduction
For better or worse, we are in an era of client side rendered, JavaScript heavy web applications. Template rendered web sites are not in vogue as they once were. However, they still have their place and it's useful to know how to make them. Can we do a template driven web site in Rust? Why yes, yes we can. There are many crates in the Rust ecosystem, but today I'd like to take a look at Tera.
[Tera](https://keats.github.io/tera/) is a powerful and flexible template engine for the Rust language. What is a template engine? Well, it's a way for you the developer to build a server side rendered web application and use templates to describe the structure and content of the app. Rather than build each page individually, using Tera you describe the overall structure and format, and the data can be dynamically pulled in on the fly.
This is an introductory article, as such I want to focus on:
- Initialize a new Rust project with a binary
- Set up Tera
- Basic usage
- Optimization with `OnceLock` from the standard library
I'm not going to build a full application in this piece, but instead want to cover the basics of getting off the ground.
Let's go!
### Initialize a New project
The starter we're going to create will be a simple Rust app which outputs raw HTML to the console. It won't have a web server and won't be tailored for deployment on Shuttle. The goal here is to give you the tools to explore on your own. Let's begin with Step #1, create a new Rust binary project:
```bash
cargo new --bin hello-world-tera
```
This will create a new project called "hello-world-tera" and will set you up with a binary crate so that you can run the project and observe the output.
### Setting Up Tera
After you've changed into the `hello-world-tera` directory, Step #2 is to add the Tera crate as a dependency to your project.
```bash
cargo add tera
```
This will make the crate available in your project.
Now, in the root of your project, create a `templates/` directory. This will serve as the central repository of all the templates you build for your project. As we'll see in a moment, at compile time they will all be pulled from this directory for rendering. Now we need an actual template. For the moment, create one called `base.html`. This will be the base template and serves as the baseline for the whole project.
```html
{{ title }}
Welcome to {{ site_name }}
{{ message }}
```
Here you can see a very rudimentary HTML file. It has some variables though, surrounded by `{{ }}`. This is the way we denote that Tera should inject something into the particular location. How exactly?
### Rendering Templates
Alright, we've got a template, what next? Let's write some actual Rust code as Step #3. In the `src` directory, go to the `main.rs` file and type in the following code:
```rust
// src/main.rs
// dependences
use tera::{Tera, Context};
// main function
fn main() {
let tera = Tera::new("templates/**/*").unwrap(); // constructor is fallible, so we unwrap() to get the good value
let mut context = Context::new();
context.insert("title", "First Steps with Tera");
context.insert("site_name", "example.com");
context.insert("message", "Hello, world!");
let rendered = tera.render("base.html", &context).unwrap(); // render() method is fallible, so we unwrap()
println!("{}", rendered);
}
```
Let's walk through it:
- We need two things to render a template, the dynamic information, and a place to put it; we bring two things into scope from the `Tera` crate, namely the [Tera](https://docs.rs/tera/1.20.0/tera/struct.Tera.html) type, which is a struct, and [Context](https://docs.rs/tera/1.20.0/tera/struct.Context.html), which is also a struct
- The `Tera` type and `Context` type are our two main tools for working with Tera templates
- We create a new Tera instance (using the contents of the directory you created in the previous step) and bind that to a variable
- Create an empty instance of `Context` which is effectively a holding container for the content to render into the template, and bind it to a variable
- Fill in the empty `context` variable with our data. Remember those `{{ }}` in the template you made? Yes, we're filling all those in with this info.
- There isn't any error handling happening here, `.unwrap()` will give us back good values from any fallible functions, but result in a panic otherwise
That's it! If you compile and run this code, you'll get your filled template rendered back to the console.
```html
First Steps with Tera
Welcome to example.com
Hello, world!
```
So, pretty easy eh? It is. There is one pitfall to watch out for though.
### Optimizing Template Rendering
Templates are very expensive to render. The above example is trivial, but in something real, you don't want to be rendering the templates from scratch every time they are requested. Instead, you want to compile them once, then put them somewhere to be re-used later. This way, they're ready and the server isn't wasting time and resources re-building every template each time they are requested.
How can we achieve this? We lean on the standard library and pull in [OnceLock](https://doc.rust-lang.org/std/sync/struct.OnceLock.html), which allows us to create a thing and tuck it off in the corner to use later. `OnceLock` is thread-safe as it implements the `Sync` marker trait which denotes it is safe for the type to be referenced from multiple threads.
Modify your `src/main.rs` to look like this:
```rust
// src/main.rs
// dependences
use std::sync::OnceLock;
use tera::{Context, Error, Tera};
// declare a static variable to hold the initialized templates
static COMPILED_TEMPLATE: OnceLock = OnceLock::new();
// function to create the tera template, handling any errors and returning them to the caller
fn create_template() -> Result {
let base_template = Tera::new("templates/**/*")?;
Ok(base_template)
}
// function to build the Tera template, returns a Result type, where
// the Ok variant is the rendered template and the error is the Error type provided by Tera
fn get_template() -> Result<&'static Tera, Error> {
let template = create_template()?;
Ok(COMPILED_TEMPLATE.get_or_init(|| template))
}
// function which renders the Tera templates, returns a Result type, where
// the Ok variant is a string of HTML and the error is the Error type provided by Tera
fn render_template() -> Result {
let mut context = Context::new();
context.insert("title", "First Steps with Tera");
context.insert("site_name", "example.com");
context.insert("message", "Hello, world!");
get_template()?.render("base.html", &context)
}
// main function
fn main() -> Result<(), Error> {
let rendered = render_template();
match rendered {
Ok(template) => println!("{}", template),
Err(e) => eprintln!("Error: {}", e),
}
Ok(())
}
```
There's a lot here, and I've handled errors. What changed and how is this better?
- The `OnceLock` type is brought into scope from `std::sync` in the standard library
- Fun fact: `OnceLock` used to be part of the `once_cell` crate, which was brought into the Rust standard library with version 1.70
- The `Context`, `Error`, and `Tera` types are brought into scope from the `Tera` crate
- We declare a static variable to hold our compiled template, it's initialized with an empty value by using the `OnceLock::new()` constructor
- We need a separate function which gets our Tera instance started and adds in the base template we created in the `templates/` directory
- Errors could happen in this process, so to handle them, we use the `?` operator to propagate any errors back to the caller
- note that, if you use the "glob" import approach, as done here, this brings all the templates in one go
- if you have templates in a different location that you want to use, you'll need to use the `.add_template_file()` for singles or the `.add_template_files()` method for multiples (see the Tera docs for more information)
- We have a function which `get_template()` which leverages the function we just created, any errors are propagated back to the caller
- You'll see that the `get_or_init()` method accepts a closure, we pass in our template that we just created
- The closure here wants to work with an actual good value, meaning we can't handle errors effectively inside the closure without an `.unwrap()`. I like to try to show how to handle errors, rather than not.
- Now that our template is compiled and placed on a shelf, so to speak, we can render it with the desired content. Two things are needed, a template, and context. Remember those variables you put into the `base.html` above? That's the context information which gets inserted into the template.
- Finally, we have a main function which calls our `render_template()` function and outputs the result, or outputs any errors
This approach is a better solution because we compile the templates once and they are saved in static memory and accessible in a thread-safe way.
That's it! You now know how to do things with Tera templating.
### Common Mistakes
There is one aspect of Tera that you have to be careful with and that's pathing. In the initialization step above (the `create_template()` function), it's really important to get your paths correct. The `Tera::new()` constructor needs a path that's absolute from the root of your project. You should also be careful to use the glob format noted above to capture everything below the template root, assuming you want that. When you use `add_template_file()` to add in a template, you have to again use an absolute path relative to your root directory.
When deploying, take care to actually include your `templates` folder with the deployment files. Been there, done that, trust me.
### Conclusion and Next Steps
To extend out this very basic starter, you can learn to work with multiple template files, by using the `add_template_files()` function. This function takes multiple files, by building their path and name info into a Vector. This example doesn't show you how to leverage templating in the context of a web server. You could do that very easily with Rocket or Axum. Rocket does a lot of the work for you, but in Axum you'll need to pull in `tower-http` as a dependency, to get access to `ServeDir` and it's methods for serving static files, which can be all the assets needed for your project, including the Tera templates.
Here are some resources to aid in your adventures with Tera:
- [Tera Documentation](https://keats.github.io/tera/)
- [Tera on crates.io](https://docs.rs/tera/1.20.0/tera/)
Good luck! And have fun!
---
# Migrating to Shuttle
Source: https://www.shuttle.dev/blog/2024/11/20/migrating-to-shuttle
Date: 20 November 2024
Author: shuttle
Tags: rust, shuttle
How to migrate an application to be able to use Shuttle
Hey! Today we're going to have a quick look at migrating a project that uses the Tokio runtime with Axum, to Shuttle.
## Setup
### Pre-requisites
Before we start, make sure you have the latest version of [cargo-shuttle](https://docs.shuttle.dev/getting-started/installation) installed.
For this example, we'll assume you are migrating an Axum project that has a database.
## Migrating your project
### Add your dependencies
The first step is to add `shuttle-runtime` and `shuttle-axum` to your dependencies to be able to use Shuttle's runtime with the Axum framework.
```bash
cargo add shuttle-runtime shuttle-axum
```
Any [secrets](https://docs.shuttle.dev/resources/shuttle-secrets) you need to use will be kept in a `Secrets.toml` file (dev secrets in `Secrets.dev.toml`) which will be placed at the `Cargo.toml` level.
You can also easily get a provisioned database like so (this example will be for a provisioned PostgreSQL instance specifically):
```bash
cargo add shuttle-shared-db --features postgres
```
If you have any database records you'd like to keep, it would be a good idea to export them so that they can be [migrated to the new database.](https://docs.shuttle.dev/guides/migrate-shared-postgres)
**You will not need a secrets file if you only need a provisioned Postgres database - this will be automatically be provisioned and given to you in the form of a connection string or an sqlx pool.**
### Migrating your code
To be able to run your project on Shuttle, you need to make a few changes to your code.
Instead of the `tokio::main` macro, you will use the `shuttle_runtime::main` macro and swap out `dotenvy` for Shuttle's Postgres annotation:
This is what your `main.rs` file might look like before:
```rust main.rs
#[tokio::main]
async fn main() {
dotenvy::dotenv().ok();
let url = dotenvy::var("DATABASE_URL").expect("No database URL was set!");
let pool = sqlx::Pool::connect(&url).await.unwrap();
sqlx::migrate!()
.run(&pool)
.await
.expect("Migrations failed :(");
let router = create_api_router(pool);
let addr = SocketAddr::from(([0, 0, 0, 0], 8000));
Server::bind(&addr)
.serve(router.into_make_service())
.await
.unwrap()
}
```
And this is what it looks like after:
```rust main.rs
#[shuttle_runtime::main]
pub async fn axum (
#[shuttle_shared_db::Postgres] pool: PgPool,
#[shuttle_runtime::Secrets] secrets: shuttle_runtime::SecretStore,
) -> shuttle_axum::ShuttleAxum {
sqlx::migrate!()
.run(&pool)
.await
.expect("Migrations failed :(");
// Use secrets for anything that needs them
let router = create_api_router(pool);
Ok(router.into())
}
```
If you need more than a simple router, you'll want to create a custom struct that holds all of your required app state information inside and then create an `impl` for the struct - you can find more about that [here.](https://docs.shuttle.dev/tutorials/custom-service) Anything outside of your entry point function (the function that uses the `shuttle_runtime::main` macro) doesn't need to be changed. If you are using secrets as well as a database connection, you may wish to create a struct that holds both of these values and then pass it into the function that generates the router. Interested? We also have some [additional docs on how to do this]()
### Deploying
To ensure that you get a unique project name, create a `Shuttle.toml` file at the `Cargo.toml` level to name your project to whatever you like.
```toml
name = "my-unique-app-name-here"
```
Now all you need to do is to run the following commands:
```bash
shuttle project start
shuttle project deploy
```
Your project should now be deployed!
## Finishing up
Thanks for reading! Hopefully this article has helped you learn what it takes to migrate to Shuttle.
Further reading:
- [How to migrate to Shuttle](https://docs.shuttle.dev/migrations/introduction)
- [Get Started with Axum](https://www.shuttle.dev/blog/2023/12/06/using-axum-rust)
- [Building with AWS S3 using Rust](https://www.shuttle.dev/blog/2024/04/17/using-aws-s3-rust)
---
# Supercharged Web Scraping with Rust & Firecrawl
Source: https://www.shuttle.dev/blog/2024/11/07/web-scraping-rust-firecrawl
Date: 7 November 2024
Author: josh
Tags: rust, tutorial, firecrawl
Simplify your Rust data pipeline with LLM-assisted web scraping
Building data aggregation pipelines can be tricky work. Having built some LLM-assisted services recently as well as a data scraping service, ironing out all of the edge cases can take a lot of time and effort (as well as selecting specifically what you want from the page!). In this article, we'll check out Firecrawl - an API for scraping the web and getting back LLM-ready ingestion material - and how you can deploy it with Shuttle.
Firecrawl can be immensely helpful for anyone looking to simplify their data pipeline. It is a self-hostable API that aims to make LLM-assisted website scraping data pipelines much simpler by allowing you to scrape websites then automatically convert it in a format that is LLM-ready. Website scraping, while not necessarily difficult, can often be a time-consuming and tricky task to get right. This is particularly relevant if the used data is part of an ingestion pipeline: for example, data aggregation services (or users who need to collect aggregate data) may use scraping for websites that do not have their own API.
Interested in checking out the code so you can deploy it or want to try running locally? [Check it out.](https://github.com/joshua-mo-143/shuttle-firecrawl-ex)
## Why use Shuttle with Firecrawl?
Shuttle allows you to deploy Rust web services seamlessly and hassle-free with one-line deploys and being able to provision your infrastructure directly from annotations (main function parameter).
Whether you need a provisioned database to store your scraping results, or a frontend for your web service so you can display your scraping results, Shuttle can do it for you. The less time you spend context switching, the more time you can spend writing code and fixing problems.
## Pre-requisites
To get started, you will need the following:
- A [Firecrawl](https://www.firecrawl.dev/) account
- A Shuttle account (with `cargo-shuttle` installed)
- The Rust programming language installed
Once you've created your Firecrawl account, don't forget to grab your API key! You will need it in a little bit.
## Getting Started
To get started, create a new Shuttle web service using `shuttle init --template axum`.
This does the following:
- Creates a new Hello World template with Axum and Tokio already added, as well as Shuttle-related dependencies (to enable deploying to Shuttle)
- Initialises a new Shuttle project (if you've chosen to do so)
Next, we'll add our required dependencies with a one-line command:
```bash
cargo add firecrawl serde -F serde/derive
```
When using Shuttle, secrets are stored in a `Secrets.toml` (`Secrets.dev.toml` for local dev) file in the project root - it should look like so:
```toml
FIRECRAWL_API_KEY = "my-api-key"
```
This is then used by an annotation macro in your main function to provide an immutable key-value store for your secrets:
```rust
use shuttle_runtime::SecretStore;
#[shuttle_runtime::main]
async fn main(
#[shuttle_runtime::Secrets] secrets: SecretStore // secrets get outputted as a variable here
) // ... rest of your code
```
Now to get started on writing code. Before we do anything else, we'll create a new `AppState` struct that will hold our Firecrawl client. This helps avoid overhead for creating the client each time we want to crawl or scrape a URL.
```rust
use firecrawl::FirecrawlApp;
#[derive(Clone)]
struct AppState {
ctx: FirecrawlApp,
}
impl AppState {
fn new(firecrawl_key: String) -> Self {
let ctx = FirecrawlApp::new(firecrawl_key)
.expect("FirecrawlApp to be created");
Self { ctx }
}
}
```
## Scraping
In this part, we'll add a simple endpoint for scraping - which will take a POST request and a URL to be scraped (as part of the JSON body).
```rust
use serde::Deserialize;
#[derive(Deserialize)]
struct Request {
url: String,
}
```
When a HTTP request is received, we should then grab our application state as well as the JSON body as function parameters. Note that the `axum::extract::State` and `axum::Json` types have been destructured to automatically provide access to the inner types (`AppState` and `Request`, respectively). We then create our `ScrapeOptions` struct and use it with our Firecrawl client to scrape a given URL, which will return two things:
- The scraped document, as a markdown file
- The original document HTML
```rust
use axum::{Json, extract::State, http::StatusCode};
use firecrawl::scrape::{ScrapeFormats, ScrapeOptions};
async fn scrape_url(
State(state): State,
Json(json): Json,
) -> Result {
let formats = vec![ScrapeFormats::Markdown, ScrapeFormats::HTML];
let scrape_opts = ScrapeOptions {
formats: Some(formats),
..Default::default()
};
let result = match state.ctx.scrape_url(&json.url, scrape_opts).await {
Ok(res) => res,
Err(e) => return Err((StatusCode::INTERNAL_SERVER_ERROR, e.to_string())),
};
Ok(Json(result))
}
```
## Hooking it all back up
Before we deploy, we need to hook everything back up to our main function! We'll hook up the async function handler to our `axum::Router` as well as our application state, then return the router.
```rust
#[shuttle_runtime::main]
async fn main(
#[shuttle_runtime::Secrets] secrets: SecretStore
) -> shuttle_axum::ShuttleAxum {
let firecrawl_api_key = secrets
.get("FIRECRAWL_API_KEY")
.expect("FIRECRAWL_API_KEY secret to exist");
let state = AppState::new(firecrawl_api_key);
let rtr = Router::new().route("/", post(scrape_url)).with_state(state);
Ok(rtr.into())
}
```
The `secrets` variable is provided as an immutable key-value store - so we can simply use the `get()` function to try to grab our API key, erroring out if it doesn't exist.
## Deploying
To deploy, all you need to do is use `shuttle deploy` and watch the magic happen! Note that you will need to add the `--allow-dirty` flag at the end if working on a dirty Git branch.
## Finishing up
Thanks for reading! Hopefully this article has made it easier for you to understand how using Firecrawl can help to accelerate your workflow and simplify your data ingestion.
Ideas for extending if you want to take this tutorial further:
- Try adding a job queue to make website scraping requests more resilient - allow users to view the results of their scrape through adding CRUD endpoints
- Try adding a database to store your results!
Further reading:
- [Make a RAG web service with Qdrant & Rust](https://www.shuttle.dev/blog/2024/02/28/rag-llm-rust)
- [Prompting AWS Bedrock with Rust](https://www.shuttle.dev/blog/2024/05/10/prompting-aws-bedrock-rust)
- [Implement an API rate limiter for your web service](https://www.shuttle.dev/blog/2024/02/22/api-rate-limiting-rust)
---
# Using Rust in sprints and marathons
Source: https://www.shuttle.dev/blog/2024/10/24/using-rust-in-sprints-and-marathons
Date: 24 October 2024
Author: josh
Tags: rust, opinion
Tips for using Rust in sprints and the benefits of Rust in long term projects
Rust is growing more than ever. Though not as commonplace as a language like Java or C#, it is slowly becoming a mainstream language. A lot of large companies have placed their bets on Rust: Microsoft's inclusion of Rust in the windows kernel, Android, Huawei and many of Amazon's services and more have solidified its place in the ecosystem. Through my time using Rust, I've used it in both short and longer term projects professionally and have been able to learn a lot about what Rust projects look like both in the short and long term, as well as potential pitfalls.
As mentioned in our previous article [that talks about using Rust on the backend](https://www.shuttle.dev/blog/2024/07/31/rust-on-the-backend), Rust offers a lot of advantages. Of course, it does not go without saying that what advantages Rust can offer you will depend on your use case, but for many, many developers, Rust can absolutely be the right choice.
## What does Rust look like in a sprint?
Unless you are working in a company that uses Rust across the stack, using it in the short term can be a contentious decision for many. When you are in an environment with a "ship fast and break things" mentality, it can be challenging to keep velocity in a new Rust project especially if you are not a domain expert.
### Speeding up time-to-ship with Shuttle
Shuttle makes Rust easy to ship with by providing resource annotations from code. For example, we support Postgres database resources as a code annotation through providing it to your main function as a function parameter. As well as this, we support one-line deploys that require zero infra configuration. This makes it much easier to focus on code without context switches. On projects that require a high cognitive load this can significantly reduce complexity, as well as reduce time to first deployment and iteration.
With Shuttle, you can deploy quickly and securely, which is perfect for companies like tech startups and larger companies who may be considering greenfield Rust projects.
### Not everything has to be perfect
While Rust can absolutely be the right choice for a lot of projects, it can occasionally be difficult to not get caught up in over-engineering your project or making sure your project is perfectly efficient. The beauty of Rust isn't just that you can fearlessly refactor. If you don't need a perfect solution out the gate, it can oftentimes be easier to (for example) just `.clone()` variables if you are running into complicated lifetime issues. Additionally, using `.unwrap()` or `.expect()` and then refactoring later on can also be another way to speed up development. Shortcuts like these can help speed up development in Rust significantly.
### What about after the first iteration?
Once you've managed to complete the first iteration, you can then focus on refactoring through adding crates like `eyre` or `anyhow` for better error handling or converting some functions to use more efficient parameters (for example, taking `&str` instead of `String`, or even using `AsRef` for more flexibility). You may also want to create traits for types where you want to add a generic implementation.
## What does Rust look like in a marathon?
Of course, Rust is known for being a language that shines in large-scale projects and marathons. After shipping the MVP plus a few features, it is relatively easy to add code without breaking production (not including logic bugs!) due to compile-time assistance. Being able to easily being able to set up tests in the same files as your code also helps - or if you want more in-depth tests, you can create your own test harness.
### Fearless refactoring
Fearless refactoring is not only the ability to refactor comfortably. It is also knowing that once you're done refactoring, it's much easier to ensure your program still works (potentially with the help of added tests for any additional functionality). It is no secret that Rust being a compiled, statically typed language helps significantly with this. However, traits also allow additional compile-time guarantees that are typically not possible in many languages where a programming sprint may turn into a marathon (Python without `basedpyright`, JavaScript, etc...). While it's possible to still cause deadlocks and memory leaks in Rust, typically you won't have to think about runtime errors as much due to compile-time checks.
### Onboarding new developers
Typically, in a large project, you'll already have one or two senior developers who can onboard less experienced members. Rust plays extremely well into this, as coding in Rust can often lead to better dev practices. This is absolutely what you want for a long term project, especially if the team members are going to stick around for a while.
## Finishing up
For both short and long term projects, Rust can be a great language, and its recent growth has showcased this. Fast, secure programming is key to sprints that lead into marathons. If you're looking to try and use Rust, whether in a new greenfield project or as an addition to a current project, feel free to reach out and let us know what you are working on!
More reading:
- [Everything you need to know about testing in Rust](https://www.shuttle.dev/blog/2024/03/21/testing-in-rust)
- [Event driven services with Kafka and Rust](https://www.shuttle.dev/blog/2024/04/25/event-driven-services-using-kafka-rust)
- [Getting started with Actix Web](https://www.shuttle.dev/blog/2023/12/15/using-actix-rust)
---
# Using Kubernetes with Rust
Source: https://www.shuttle.dev/blog/2024/10/22/using-kubernetes-with-rust
Date: 22 October 2024
Author: jubril
Tags: rust, kubernetes, tutorial
Interacting with a Kubernetes cluster from Rust with `kube-rs`
If you have ever tried to deploy a service in the last three to four years, there's a good chance someone has suggested using Kubernetes; however, if this is your first time hearing of Kubernetes, welcome. Kubernetes is an orchestrator that makes it easy to run large-scale containerized applications.
What makes Kubernetes really great is its extensibility, by using the API users are able to create custom applications that don't ship with Kubernetes out of the box, It's how we have great tools like [ArgoCD](https://argo-cd.readthedocs.io/en/stable/).
If you clicked on this post, you are likely familiar with Kubernetes and looking to take things a step further, regardless of why you are here. In this article, we will look at a bunch of useful operations for interacting with Kubernetes using the planet's most loved crab language, Rust.
## Getting Started
To create a local Kubernetes cluster, we will use [KinD](https://kind.sigs.k8s.io/), a tool that allows you to run Kubernetes in Docker, hence the name KinD. Don't forget to have Docker installed!
If you're on Mac, you can install kind using brew:
```bash
brew install kind
```
For Linux users, if you have Go installed and [path set correctly](https://www.google.com/search?client=firefox-b-d&q=setting+gopath), you can install KinD using:
```bash
go install sigs.k8s.io/kind@v0.24.0
```
With that installed, you can create a new cluster by running:
```bash
kind create cluster --name krust-playground
```
### Pre-requisites
Along with KinD, you will also need to install Kubectl. If you are feeling adventurous, you can install that right away using:
```bash
curl -LO "https://dl.k8s.io/release/$(curl -L -s https://dl.k8s.io/release/stable.txt)/bin/linux/amd64/kubectl"
```
And for ARM machines:
```bash
curl -LO https://dl.k8s.io/release/v1.31.0/bin/linux/arm64/kubectl
```
Otherwise, take a look at [this section](https://kubernetes.io/docs/tasks/tools/#kubectl) of the Kubernetes docs for more specific installation instructions.
## Kube-rs?
To interact with the Kubernetes API we will need a client library. As described in the project's readme, `kube-rs` is:
| A [Rust](https://rust-lang.org/) client for [Kubernetes](http://kubernetes.io/) in the style of a more generic [client-go](https://github.com/kubernetes/client-go), a runtime abstraction inspired by [controller-runtime](https://github.com/kubernetes-sigs/controller-runtime), and a derive macro for [CRDs](https://kubernetes.io/docs/tasks/extend-kubernetes/custom-resources/custom-resource-definitions/) inspired by K[ubebuilder](https://book.kubebuilder.io/reference/generating-crd.html)
## Project Setup
Create a new cargo project:
```bash
cargo init k8s-rs
```
Add the following crates to your `Cargo.toml`
```toml
[dependencies]
tokio = { version = "1", features = ["full"] }
kube = { version = "0.95.0", features = ["runtime", "derive" , "ws"] }
k8s-openapi = { version = "0.23.0", features = ["latest"] }
serde_json = "1.0"
tracing = "0.1.37"
tokio-util = { version = "0.7.8", features = ["io"] }
tokio-stream = { version = "0.1.9", features = ["net"] }
tracing-subscriber = "0.3.17"
futures = "0.3.28"
anyhow = "1.0.71"
schemars = "0.8.12"
serde = { version = "1.0", features = ["derive"] }
yaml-rust2 = "0.8"
```
## Connecting to Your Cluster
We'll begin by looking at how to connect to the cluster we created earlier. By default, your connection information is stored in `~/.kube/config`. To use this in Rust, we can use the following code:
We'll begin by looking at how to connect to the cluster we created earlier:
```rust
use kube::{Config};
#[tokio::main]
async fn main() -> Result<(), Box> {
let config = Config::infer().await?;
println!(
"Connected to cluster at {:?}",
config.cluster_url.host().unwrap()
);
Ok(())
}
```
Using `Config::infer()` `kube-rs` will attempt to connect to the cluster using your default [kubeconfig](https://kubernetes.io/docs/concepts/configuration/organize-cluster-access-kubeconfig/).
## Creating a Client
Using the config is great for printing out cluster information, but we can't use it to interact with it. To create a new cluster, we can use `Client::try_default()`, which calls `Client::infer()` under the hood and returns a new client:
```rust
use kube::{Client};
#[tokio::main]
async fn main() -> Result<(), Box> {
let client = Client::try_default().await?;
Ok(())
}
```
## Working with Pods
Pods are a fundamental resource in Kubernetes. To create one using `kube-rs` we can use the following code:
### Create a pod
```rust
use k8s_openapi::api::core::v1::Pod;
use kube::{Api, Client, Config};
use serde_json::json;
#[tokio::main]
async fn main() -> Result<(), Box> {
let client = Client::try_default().await?;
let pods: Api = Api::default_namespaced(client);
// Define the Pod using a JSON spec
let pod_json = json!({
"apiVersion": "v1",
"kind": "Pod",
"metadata": {
"name": "pong-pod"
},
"spec": {
"containers": [{
"name": "pong-container",
"image": "ghcr.io/s1ntaxe770r/pong"
}]
}
});
let pod = serde_json::from_value(pod_json)?;
let pod = pods.create(&kube::api::PostParams::default(), &pod).await?;
println!("Pod created: {}", pod.metadata.name.unwrap());
Ok(())
}
```
This works, but as we start to work with larger objects, it can quickly get confusing, and who really likes writing json?
Alternatively, you can create a pod by using a struct; we will be using this method going forward.
```rust
use k8s_openapi::api::core::v1::{Container, Pod, PodSpec};
use kube::api::{ObjectMeta, PostParams};
use kube::{Api, Client};
#[tokio::main]
async fn main() -> Result<(), Box> {
let client = Client::try_default().await?;
let pods: Api = Api::default_namespaced(client);
let pod = Pod {
metadata: ObjectMeta {
name: Some("pong-pod".to_string()),
..Default::default()
},
spec: Some(PodSpec {
containers: vec![Container {
name: "pong-container".to_string(),
image: Some("ghcr.io/s1ntaxe770r/pong".to_string()),
..Default::default()
}],
..Default::default()
}),
..Default::default()
};
let pod = pods.create(&PostParams::default(), &pod).await;
match pod {
Ok(pod) => {
println!("created pod {}", pod.metadata.name.unwrap());
}
Err(e) => {
println!("unable to create pod {}", e)
}
}
Ok(())
}
```
### Listing pods
Another common operation is listing pods. With the code snippet below, we can list the pods in the `kube-system` namespace.
```rust
use k8s_openapi::api::core::v1::Pod;
use kube::{api::ListParams, Api, Client};
#[tokio::main]
async fn main() -> Result<(), Box> {
let client = Client::try_default().await?;
let pods: Api = Api::namespaced(client, "kube-system");
let list_params = ListParams::default();
for pod in pods.list(&list_params).await? {
println!("Found Pod {:?}", pod.metadata.name.unwrap())
}
Ok(())
}
```
We can also filter what pods by using labels. Labels are customizable key/value tags attached to objects, used for organization.
```rust
use k8s_openapi::api::core::v1::Pod;
use kube::{api::ListParams, Api, Client};
#[tokio::main]
async fn main() -> Result<(), Box> {
let client = Client::try_default().await?;
let pods: Api = Api::namespaced(client, "kube-system");
let list_params = ListParams::default().labels("component=kube-apiserver");
for pod in pods.list(&list_params).await? {
println!("Found Pod {:?}", pod.metadata.name.unwrap())
}
Ok(())
}
```
In this example, only pods with the label `component=kube-apiserver` will be returned.
### Updating Pods
While creating and listing pods are everyday tasks, you'll often need to update existing pods. Let's look at an example of adding labels to a pod.
First, let's add a label to our existing `pong-pod`:
```rust
use k8s_openapi::api::core::v1::Pod;
use kube::{Api, Client, Config};
use kube::api::{Patch, PatchParams};
use serde::{Serialize, Deserialize};
#[derive(Serialize, Deserialize,Debug)]
struct PodPatch {
metadata: PodMetadataPatch,
}
#[derive(Serialize, Deserialize,Debug)]
struct PodMetadataPatch {
labels: std::collections::BTreeMap,
}
#[tokio::main]
async fn main() -> Result<(), Box> {
let client = Client::try_default().await?;
let pods: Api = Api::default_namespaced(client);
let mut new_labels = std::collections::BTreeMap::new();
new_labels.insert("environment".to_string(), "production".to_string());
let patch = PodPatch {
metadata: PodMetadataPatch {
labels: new_labels,
},
};
let params = PatchParams::default();
let patched_pod = pods.patch("pong-pod", ¶ms, &Patch::Merge(&patch)).await?;
println!("Pod updated with new label: {:?}", patched_pod.metadata.labels);
Ok(())
}
```
### Deleting Pods
Finally, we can delete pods using the following code:
```rust
use k8s_openapi::api::core::v1::Pod;
use kube::api::{DeleteParams, Patch, PatchParams};
use kube::{Api, Client};
use serde_json::json;
#[tokio::main]
async fn main() -> Result<(), Box> {
let client = Client::try_default().await?;
let pods: Api = Api::default_namespaced(client);
let delete_params = DeleteParams::default();
pods.delete("pong-pod", &delete_params).await?;
println!("deleted pod");
Ok(())
}
```
## Interacting with running Pods
Switching gears a little, let's explore how to interact with running pods.
**Fetching logs from a Pod**
Often, you'll want to see what's happening inside a pod to debug issues or monitor application behavior. We can mimic the functionality of `kubectl logs` using the kube-rs. Here's a snippet showing how to fetch logs from the API server:
```rust
use k8s_openapi::api::core::v1::{Container, Pod, PodSpec, ContainerPort};
use kube::{Api, Client, ResourceExt};
use kube::api::{PostParams, WatchEvent};
use futures::{StreamExt, TryStreamExt};
use tokio::time::{Duration, sleep};
#[tokio::main]
async fn main() -> Result<(), Box> {
// Initialize the Kubernetes client
let client = Client::try_default().await?;
let pods: Api = Api::default_namespaced(client);
// Define the Pod with port 80 exposed
let pod = Pod {
metadata: kube::api::ObjectMeta {
name: Some("nginx-example".to_string()),
..Default::default()
},
spec: Some(PodSpec {
containers: vec![Container {
name: "nginx".to_string(),
image: Some("nginx:latest".to_string()),
ports: Some(vec![ContainerPort {
container_port: 80,
..Default::default()
}]),
..Default::default()
}],
..Default::default()
}),
..Default::default()
};
// Create the Pod
let pod = pods.create(&PostParams::default(), &pod).await?;
println!("Created pod: {}", pod.name_any());
// Wait for the Pod to be ready
let timeout = Duration::from_secs(60);
let start = std::time::Instant::now();
loop {
let pod = pods.get("nginx-example").await?;
let status = pod.status.as_ref().expect("Pod status should be available");
let Some(phase) = &status.phase else {
if start.elapsed() > timeout {
return Err("Timed out waiting for pod to be ready".into());
}
sleep(Duration::from_secs(1)).await;
continue;
};
if phase == "Running" {
println!("Pod is running");
break;
}
if start.elapsed() > timeout {
return Err("Timed out waiting for pod to be ready".into());
}
sleep(Duration::from_secs(1)).await;
}
// Fetch logs
let logs = pods.logs("nginx-example", &Default::default()).await?;
println!("Pod logs:\n{}", logs);
Ok(())
}
```
This example demonstrates a slightly more realistic scenario of working with Pods in a Kubernetes cluster. We create a Pod running Nginx, wait for it to be ready, and then fetch its logs.
After creating the Pod, we use the `status` field to determine if the Pod is running:
```rust
let Some(phase) = &status.phase else {
if start.elapsed() > timeout {
return Err("Timed out waiting for pod to be ready".into());
}
sleep(Duration::from_secs(1)).await;
continue;
};
```
### Port forwarding to a Pod
Sometimes, you need to interact directly with a service running in a pod. We can replicate the functionality of `kubectl port-forward`. Here's a stripped-down version of port forwarding, adapted from the kube-rs repository:
First, let's set up the Kubernetes client and wait for our pod to be running:
```rust
use anyhow::Context;
use std::net::SocketAddr;
use k8s_openapi::api::core::v1::Pod;
use kube::{
api::Api,
runtime::wait::{await_condition, conditions::is_pod_running},
Client, ResourceExt,
};
use tracing::*;
use futures::StreamExt;
use futures::TryStreamExt;
use tokio::net::{TcpListener, TcpStream};
use tokio_stream::wrappers::TcpListenerStream;
#[tokio::main]
async fn main() -> Result<(), Box> {
tracing_subscriber::fmt::init();
let client = Client::try_default().await?;
let pods: Api = Api::default_namespaced(client);
// Get the Pod
let p = pods.get("nginx-example").await?;
info!("Found pod: {}", p.name_any());
// Wait until the pod is running
let running = await_condition(pods.clone(), "nginx-example", is_pod_running());
tokio::time::timeout(Duration::from_secs(60), running).await??;
info!("Pod is running");
}
```
Next, we'll set up the local address to forward traffic to:
```rust
// ... (in main function)
let addr = SocketAddr::from(([127, 0, 0, 1], 8080));
let pod_port = 80;
info!(local_addr = %addr, pod_port, "forwarding traffic to the pod");
info!(
"try opening http://{0} in a browser, or `curl http://{0}`",
addr
);
info!("use Ctrl-C to stop the server and delete the pod");
```
Using a `TcpListenerStream`, we set up a local TCP server that listens for incoming connections:
```rust
let server = TcpListenerStream::new(TcpListener::bind(addr).await?)
.take_until(tokio::signal::ctrl_c())
.try_for_each(|client_conn| async {
if let Ok(peer_addr) = client_conn.peer_addr() {
info!(%peer_addr, "new connection");
}
let pods = pods.clone();
tokio::spawn(async move {
if let Err(e) = forward_connection(&pods, "nginx-example", 80, client_conn).await {
error!(
error = e.as_ref() as &dyn std::error::Error,
"failed to forward connection"
);
}
});
Ok(())
});
if let Err(e) = server.await {
error!(error = &e as &dyn std::error::Error, "server error");
}
info!("Shutting down");
```
Finally, let's look at the function that forwards the connection:
```rust
async fn forward_connection(
pods: &Api,
pod_name: &str,
port: u16,
mut client_conn: TcpStream,
) -> anyhow::Result<()> {
let mut forwarder = pods.portforward(pod_name, &[port]).await?;
let mut upstream_conn = forwarder
.take_stream(port)
.context("port not found in forwarder")?;
tokio::io::copy_bidirectional(&mut client_conn, &mut upstream_conn).await?;
drop(upstream_conn);
forwarder.join().await?;
info!("connection closed");
Ok(())
}
```
## Working with Custom Resources
Kubernetes has an interesting concept called custom resources. These allow you to extend the Kubernetes API and add new resources. This by itself isn't very descriptive, so let's take things a step further with an example.
Say you wanted to inform Kubernetes about a new resource called `crustacean`. By default if you run `kubectl get crustacean`, you will get an error saying `error: the server doesn't have a resource type "crustacean."`. To create the resource, start out by defining a new custom resource:
```rust
use kube::CustomResource;
use kube::ResourceExt;
use schemars::JsonSchema;
use serde::{Deserialize, Serialize};
#[derive(CustomResource, Deserialize, Serialize, Clone, Debug, JsonSchema)]
#[kube(
group = "experiments.gopherlabs.io",
version = "v1",
kind = "Crustacean",
printcolumn = r#"
{"name": "Habitat", "type": "string", "jsonPath": ".spec.habitat"}
"#
)]
pub struct CrustaceanSpec {
pub name: String,
pub species: String,
pub habitat: Option,
}
#[tokio::main]
async fn main() -> Result<(), Box> {
Ok(())
}
```
We can generate a manifest using the following code:
```rust
use kube::CustomResource;
use kube::CustomResourceExt;
use schemars::schema_for;
use schemars::JsonSchema;
use serde::{Deserialize, Serialize};
use std::fs::File;
use std::io::Write;
use yaml_rust2::{YamlEmitter, YamlLoader};
#[tokio::main]
async fn main() -> Result<(), Box> {
let larry = Crustacean::new(
"larry",
CrustaceanSpec {
species: "lobster".to_string(),
habitat: Some("Atlantic Ocean".to_string()),
},
);
// Convert the CRD to JSON first
let crd_json = serde_json::to_string(&larry)?;
// Parse the JSON to yaml_rust2::Yaml
let docs = YamlLoader::load_from_str(&crd_json)?;
let doc = &docs[0];
// Emit YAML
let mut out_str = String::new();
{
let mut emitter = YamlEmitter::new(&mut out_str);
emitter.dump(doc)?;
}
// Write the CRD to a YAML file
let mut file = File::create("crustacean_crd.yaml")?;
file.write_all(out_str.as_bytes())?;
println!("\nCRD written to crustacean_crd.yaml");
Ok(())
}
```
Running the above code will produce the following manifest:
```yaml
apiVersion: experiments.gopherlabs.io/v1
kind: Crustacean
metadata:
name: larry
spec:
species: lobster
habitat: Atlantic Ocean
```
Great, but Kubernetes still has no idea how to handle this CRD. To do this, we need to apply the custom resource definition to the cluster:
```rust
use k8s_openapi::apimachinery::pkg::apis::meta::v1::ObjectMeta;
use kube::{api::PostParams, Api, Client, CustomResource};
use schemars::JsonSchema;
use serde::{Deserialize, Serialize};
use std::fs;
use yaml_rust2::YamlLoader;
impl Crustacean {
pub fn new_crustacean(species: String, habitat: Option, name: String) -> Self {
Crustacean {
metadata: ObjectMeta {
name: Some(name),
..Default::default()
},
spec: CrustaceanSpec { species, habitat },
}
}
}
#[tokio::main]
async fn main() -> Result<(), Box> {
// Create a client to interact with the Kubernetes API
let client = Client::try_default().await?;
// Read the Crustacean instance from the YAML file
let crustacean_yaml = fs::read_to_string("crustacean_crd.yaml")?;
let yaml_docs = YamlLoader::load_from_str(&crustacean_yaml)?;
let yaml_doc = &yaml_docs[0];
// Extract values from YAML
let name = yaml_doc["metadata"]["name"].as_str().unwrap_or("").to_string();
let species = yaml_doc["spec"]["species"]
.as_str()
.unwrap_or("")
.to_string();
let habitat = yaml_doc["spec"]["habitat"].as_str().map(String::from);
// Create Crustacean instance
let crustacean = Crustacean::new_crustacean(species, habitat, name);
// Apply the Crustacean instance
let crustaceans: Api = Api::all(client.clone());
crustaceans
.create(&PostParams::default(), &crustacean)
.await?;
println!("Crustacean instance applied successfully");
Ok(())
}
```
There are a couple of things going on in the snippet above, the important parts:
- Using the `fs` crate, we load the yaml file from the current directory.
- We introduce a helper method called `new_crustacean` to help with some of the setup for the CRD definition. After extracting the values from the yaml file, we pass the parameters to the `new_crustacean` function and apply the manifest.
- The `ensure_crd` function checks if the CRD exists in the cluster before applying the manifest, this is essential because kubernetes will try and validated the manifest we apply against the CRD schema.
```rust
async fn ensure_crd(client: &Client) -> Result<(), Box> {
let crds: Api = Api::all(client.clone());
let lp = ListParams::default().fields("metadata.name=crustaceans.experiments.gopherlabs.io");
let existing_crds = crds.list(&lp).await?;
if existing_crds.items.is_empty() {
println!("CRD not found. Creating new CRD.");
let crd = Crustacean::crd();
crds.create(&PostParams::default(), &crd).await?;
println!("CRD created successfully")
} else {
println!("CRD already exists. Skipping creation.");
}
Ok(())
}
```
At this point, you should be able to run:
```rust
kubectl get crustaceans
```
The output is similar to:
```rust
NAME HABITAT
larry Atlantic Ocean
```
## Watching for Resource Changes
So we've got our `Crustacean` CRD up and running. But creating resources is only half the battle. More often you want to react to events in the cluster this is where [watchers](https://kubernetes.io/docs/reference/using-api/api-concepts/#efficient-detection-of-changes) come in, as the name suggests, watchers are used to monitor specific events.
In our case, we'll monitor for new `Crustacean` resources and create a pod for each one.
```rust
use futures::{stream, StreamExt, TryStreamExt};
use k8s_openapi::{api::core::v1::Pod, apiextensions_apiserver::pkg::apis::apiextensions::v1::CustomResourceDefinition};
use kube::{api::{PostParams, ListParams}, runtime::{watcher, WatchStreamExt}, Api, Client, CustomResource, CustomResourceExt, runtime::wait::{await_condition, conditions::is_pod_running},};
use schemars::JsonSchema;
use serde::{Deserialize, Serialize};
use tracing::*;
use tokio::time::Duration;
#[tokio::main]
async fn main() -> Result<(), Box> {
let client = Client::try_default().await?;
tracing_subscriber::fmt::init();
// Watch for Crustacean resources
let crustaceans: Api = Api::all(client.clone());
let lp = ListParams::default();
let mut crustacean_watcher = watcher(crustaceans, watcher::Config::default()).applied_objects().boxed();
// Watch loop: create a pod when a Crustacean resource is applied
while let Some(crustacean) = crustacean_watcher.try_next().await? {
let crustacean_name = crustacean.metadata.name.unwrap();
let pod_name = crustacean_name.clone();
info!("got crustacean {} , creating pod....",crustacean_name.clone());
// Create a pod with the same name as the Crustacean resource
let pods: Api = Api::namespaced(client.clone(), "default");
let pod = Pod {
metadata: kube::api::ObjectMeta {
name: Some(crustacean_name.clone()),
..Default::default()
},
spec: Some(k8s_openapi::api::core::v1::PodSpec {
containers: vec![k8s_openapi::api::core::v1::Container {
name: "crustacean-container".to_string(),
image: Some("nginx".to_string()),
..Default::default()
}],
..Default::default()
}),
..Default::default()
};
pods.create(&PostParams::default(), &pod).await?;
let running = await_condition(pods.clone(), &pod_name, is_pod_running());
tokio::time::timeout(Duration::from_secs(60), running).await??;
println!("Pod '{}' created for Crustacean resource.", crustacean_name);
}
Ok(())
}
```
Using the following code (as from the above code snippet):
```rust
let mut crustacean_watcher = watcher(crustaceans, watcher::Config::default())
.applied_objects()
.boxed();
```
We set up a **watcher** to monitor the `Crustacean` custom resource, using the `applied_objects()`: method ensures that we only care about the resources that have been applied (created or updated). It filters out other events like deletions.
In the **while loop**, we watch for events in the stream provided by the `crustacean_watcher`. For each `Crustacean` resource that the watcher detects, we create a Pod.
Using `await_condition(pods.clone(), &pod_name, is_pod_running())`creates a future that waits for the condition where the Pod is running. `is_pod_running()` is a predefined condition function that checks the Pod's status to see if it's in the "Running" state.
Running the example should result in the following output:
```rust
warning: `k8s-rs` (bin "k8s-rs") generated 4 warnings (run `cargo fix --bin "k8s-rs"` to apply 3 suggestions)
Finished `dev` profile [unoptimized + debuginfo] target(s) in 2.42s
Running `target/debug/k8s-rs`
2024-09-23T20:59:43.549885Z INFO k8s_rs: got crustacean larry , creating pod....
Pod 'larry' created for Crustacean resource.
```
And if we run `kubectl get pods`:
```rust
NAME READY STATUS RESTARTS AGE
app-deployment-6c8d544675-rn56b 1/1 Running 0 30h
larry 1/1 Running 0 9s
nginx-example 1/1 Running 0 19h
patch-add-ephemeral-container 1/1 Running 64 (8m51s ago) 45h
pong-deployment-84d87cb454-tqct9 2/2 Running 0 30h
```
Sure enough, Larry should be there.
## Summary
If you made it to this part, you probably are really interested in `kube-rs`. While the library is pretty neat, Kubernetes has a LOT of API's and can quickly get confusing. When working with `kube-rs` or Kubernetes in general, here are some things to keep in mind.
### Know when to use a controller or an operator.
These concepts have some overlap and can be very confusing, which is why I avoided mentioning so as not to blow this out of scope. Luckily, people far smarter than me have written on this topic. Check out Ivan Velichko's guide on [Kubernetes operators.](https://iximiuz.com/en/posts/kubernetes-operator-pattern/) Looking for something with more Rust? The folks at Metalbear have an entire guide on [creating an operator using kube-rs](https://metalbear.co/blog/writing-a-kubernetes-operator/).
### Examples don't bite
The maintainers of `kube-rs` did an amazing job of creating several examples of using the crate. This guide is not an exhaustive list of all its features; some of the [examples used here](https://github.com/kube-rs/kube/tree/main/examples) were adapted from the repo.
Using Rust to interact with Kubernetes can be quite refreshing, especially if you come from the [Kubebuilder](https://github.com/kubernetes-sigs/kubebuilder) world. Creating a CRD by adding a [macro](https://www.shuttle.dev/blog/2022/12/23/procedural-macros) is extremely powerful, and in my experience thus far, I have written less code to achieve common functionality. If you're curious about admission controllers, check out the guide I wrote [here](https://www.civo.com/learn/kubernetes-admission-controllers-for-beginners?ref=shuttle.dev).
## Conclusion
Of course, you don't need Kubernetes for everything. If you're interested in something more simple, Shuttle is your one-stop shop for easy Rust deployments. Create (or migrate) your project, use `shuttle deploy`, and watch the magic happen!
---
# Shuttle's New Platform — Redefining Backend Development
Source: https://www.shuttle.dev/blog/2024/10/10/shuttle-redefining-backend-development
Date: 10 October 2024
Author: ivan
Tags: rust, announcement, shuttle
We've supercharged what developers love about Shuttle, combining our powerful developer experience with enterprise-grade infrastructure.
## Introduction
Today we're introducing the new Shuttle platform! We've supercharged what developers love about Shuttle, combining our powerful developer experience with enterprise-grade infrastructure. For developers, we've kept it simple and intuitive - no complex configs, just focus on your Rust code. On the production side, we've implemented VM-level isolation, increased reliability and scalability to meet real-world demands. From solo developers to enterprise teams, Shuttle now offers the perfect blend of ease and production-ready robustness.
## Our Vision
Shuttle is a new way of building and deploying cloud applications. We make dealing with cloud infrastructure simple and enjoyable so developers can focus on creating great products. Today, developers face a choice between the flexibility of large cloud providers and the simplicity of PaaS solutions, each with limitations. At Shuttle, we're forging a middle path—prioritising simplicity while preserving flexibility. Our open-source framework, [**_Infrastructure from Code_ (IfC)**](https://www.shuttle.dev/blog/2022/05/09/ifc), combined with our state-of-the-art platform, lets developers annotate their code to configure infrastructure and deploy instantly. IfC enables developers using GenAI to optimise cloud infrastructure setup and automate complex tasks, saving vast amounts of time.
### Backstory
Over the past year we've seen Rust adoption increase by 64%, and our user base has tripled to 15,000+ developers. The number of projects deployed on Shuttle? That's grown five times over. It's been an exciting journey, and to embrace this growth and support more production use-cases, we've built something extraordinary. We're excited to introduce our new platform that's more scalable, secure, and powerful than ever!
## Introducing the New Platform Public Preview
The new Shuttle platform takes what developers already love and cranks it up a notch. We've kept the great developer experience you're used to and combined it with production-ready infrastructure, ready to tackle your most ambitious projects.
- **For Developers**: The seamless, intuitive experience you love — now smoother than ever. Our unique approach eliminates the need for complex configuration files or deep cloud expertise. With Shuttle you focus on writing your Rust code, while we handle the complexities of the cloud - deployment, scaling, and infrastructure management. Features like automatic database provisioning and effortless API integration remain at your fingertips from within your IDE, but are now enhanced with even greater reliability and performance.
- **For Production**: With a Pro-tier experience tailored for putting things in production, building and operating distributed systems at scale is now a joy. We've upgraded our observability stack for even better uptime and faster incident response, letting you rest easy while we handle service restoration. Shuttle's enhanced capabilities for horizontal scaling, tenant isolation, security patching, and fault tolerance ensure your app scales seamlessly as demand grows. Watch out for exciting new features in this space!
Whether you're a solo developer working on a passion project or an enterprise team deploying mission-critical applications, the new Shuttle platform has you covered. The perfect balance of development ease and production readiness.
## What's new?
### Scalability
Our new system can handle 10 times more concurrent requests, 10 times more active projects with high uptime, and 20 times more concurrent builds. In simple terms, we've gone from a single-stage rocket to a fully reusable spacecraft. More payload, faster turnaround, and ready to explore new frontiers.
### Reliability
We've put in place workload isolation and beefed up our monitoring. This means one resource-hungry project can't slow down others, and we can spot and fix issues faster than ever.
### Security
We implemented VM-level isolation. Now, each project runs in its own little "world", completely separate from others.
### Builder Service
We've completely revamped how we build projects. Our new system is more scalable, flexible and is built to handle a wider variety of build requirements.
### Laying the Groundwork for the Future
By adopting container builds and a modular architecture, we've opened doors to exciting possibilities. While Rust remains our focus, we're now positioned to potentially support multiple languages in the future. Imagine bringing Shuttle's simple, joyful backend experience to your favourite language. It's ambitious, and we're one step closer to creating the best cloud experience for all developers.
### New Domain
We have changed our domain name to shuttle.dev! The new platform is available to use via the [shuttle.dev](https://www.shuttle.dev) console. However, if you're an existing user looking to access the old platform and navigate between the two, you can find instructions [here](https://docs.shuttle.dev/introduction/platform-update).
## What does this mean for you?
Whether you're a new user or have been with us from the start - you're in for a treat. Here's what you can expect from our new platform:
- Better security with VM-level isolation between projects.
- Ability to scale bigger and faster, handling sudden traffic reliably.
- More stable performance across the board, unaffected by other busy projects.
- Support for more complex builds, pushing the boundaries of what's possible.
- Automatic restarts for improved reliability and uptime.
### Looking to migrate your project?
Check out the [docs](https://docs.shuttle.dev/introduction/platform-migration) to find out more and get in touch via [Discord](https://discord.gg/shuttle), [Email](mailto:support@shuttle.rs) or Intercom if you need any support!
## Pricing for every use-case
Building in the cloud shouldn't be harder to use as your demands grow. Don't sacrifice developer experience for production requirements. For us, developer experience isn't just a feature, it's at the core of our company and we're building our pricing with that in mind:
**Free Tier — Perfect Starting Point**
- Ideal for hobbyists, students, and new ideas
- Offers a fantastic developer experience for learning and experimentation—the perfect place to start with Shuttle without incurring costs
- Growth engine for our vibrant community
**Pro Tier — Streamlined Production Experience**
- Ideal for small to medium-sized production use cases
- Offers a reliable and scalable off-the-shelf production experience
- Access to advanced features (including AI-powered ones) to supercharge your development
**Enterprise Tier — Tailored Solutions for Complex Needs**
- Ideal for larger enterprises or more complex use-cases
- Focused on providing tailor-made production value and solving organizational challenges
- Offers flexible deployment options to meet your specific requirements and dedicated support
**No matter your scale or needs, Shuttle has the perfect solution** to elevate your development experience and streamline your cloud deployments. From individual developers to enterprise teams, we're here to support your journey and help you build amazing applications with ease. If you have any questions for your specific use-case, [click here](https://cal.com/team/shuttle/shuttleproductdiscoverycall) book a call!
## Join Us
We built Shuttle to break down cloud development barriers and provide the best backend experience possible making cloud deployment as intuitive as writing code. Whether you're a long-time user or new to Shuttle, now's the time to try the new platform.
Get started now and head to [shuttle.dev](https://www.shuttle.dev) to join us redefining backend development.
---
# Why I Learned Rust - as a Python dev
Source: https://www.shuttle.dev/blog/2024/09/18/why-i-learned-rust-mark
Date: 18 September 2024
Author: mark
Tags: rust, opinion
The story of how one developer, who currently works at Shuttle, came to Rust from Python.
## How It Started
Way back in the ancient year of 2016 I founded a SaaS startup in the FinTech space. In addition to my role as founder, I also served as the head (read: _sole_) maintainer of the in-house utility-wrapper-client-library-*thing*¹ that actually enabled customers to _use_ the platform. It was written in Python, and included support for more than 6 different (rather niche) industry-specific softwares, enabling near-real-time synchronization between customer's brick-and-mortar stores and our backend.
I say near-real-time for two reasons - first, even a minute or two of lag between a record being changed in a customer's system and that change being reflected in our backend was absolutely head and shoulders above customer ask or expectation, so I never aimed to improve that aspect of things. Second though, and more germane to the topic at hand, some of the softwares we supported hadn't been updated since (and this is not a joke or exaggeration) 1992. They did not use anything that might be considered a "modern" data storage format, nor did they even include any real concept of networked _anything_ newer than perhaps FTP.
The plugin to the utility-wrapper-client-library-*thing*¹ that supported that specific software was the absolute unquestioned bane of my existence. By necessity, it had to be written initially as a hand-coded parser for the specific format the customer-side software stored data in which meant it was effectively read-only. Moreover, while writing in Python did lower the bar pretty dramatically, it also meant that it was doing disk and network I/O _in Python_. To make matters that much worse, due to a quirk of the storage format along with the requirements of what the support wrapper was actually doing meant that the plugin couldn't chunk or lazy load the file(s) in question - it _had_ to read each one into memory in its entirety every single time a sync needed to be performed. Oh and naturally - let's not forget lock contention baby.
> Pictured: a biblically-accurate representation of myself working on the Python code described above

## Cue The Mysterious Stranger† On A Dark Night‡ Offering A Questionable Bargain§
† - StackOverflow
‡ - just a regular Tuesday
§ - [**_RIIR_**](https://ghost.fission.codes/content/images/2023/04/Rewrite-It-In-Rust---Postcard---Front.jpeg)
Frustrated with the frankly abysmal performance of this specific plugin, I found myself diving into ever darker waters in pursuit of the dream that has haunted Python devs since time immemorial: how to make this _one_ stupid thing bottlenecking my code performant!? 😡
Naturally I ran into all the usual answers first - threading, multiprocessing, and async. Of the seemingly available options at the time multiprocessing was out as there was just no way I was going to voluntarily double down on the lock contention issues I was already dealing with. Async seemed like an attractive option, but I'd need to learn a whole new paradigm and it didn't feel like I had the breathing room to do that at the time. That just left threading which... underwhelmed for reasons that escape my memory as I'm writing this, so we're just gonna sweep that under the rug and thank you for graciously playing along for the sake of the story.
What kept popping up though, were posts and articles about how libraries like NumPy, pandas, and SciPy had addressed performance issues. Specifically, things like [cython](https://github.com/cython/cython), [numba](https://numba.pydata.org/), and [nuitka](https://nuitka.net/). Heck, if I remember correctly, I think I may have even _tried_ nuitka. Ultimately, none of them really seemed like options worth pursuing. Reflecting on it now, my reasons seem shakier than I'd like to admit, but again - rug sweep; we're not here for self-reflection, we're here for a story!
My thinking at the time went like this:
- Cython seems like the best option, but to really get the most out of it you kinda _have_ to use the expanded syntax (which is a superset of Python, but in this case we're specifically talking about the super parts, not the Python-identical parts)
- If I'm effectively going to have to learn a new programming language, maybe I should consider options other than Cython; after all, FFI is a thing and maybe there's something better?
- Blow dust off C/C++ books from college- _Immediate no, hard pass_
- Hmmm... [go](https://go.dev/) has been getting a lot of press lately, can you write Python extensions in go?
- Answer: surprisingly, [_yes_](https://github.com/asottile/setuptools-golang)
- note: there are likely better tools for this now, but I distinctly recall `setuptools-golang` existing at the time. In the interest of full disclosure, "it exists" is about as far as I got into it though.
- StackOverflow _really_ seems to love rust too though. Can you write Python extensions in rust?
- Answer: [absolutely](https://github.com/PyO3/pyo3), 110% you can, and it's like... _easy_. Like almost laughably, comically easy. Though for story purposes, I didn't know that at _this_ precise moment in the narrative.
- What's the real difference between rust and go?
- So far outside the scope of this story I don't even have a postal code for it
- _At the time though:_
- go was billed as having a less steep learning curve, and as primarily offering type-safety, speed, and _really, really_ good concurrency
- rust was billed as having a near-mythical learning curve, but offering a feature-set that almost boiled down to "if it _compiles at all_, it'll run without issue" along with an almost draconian stance on compatibility and the meaning of semver on the part of the maintainers that meant that the "if it compiles..." could be extended with "without any real maintenance, basically forever"
What clinched it for me was an admittedly niche experience with a hard-to-replicate bug that _somehow_ was caused by _something_ inherent to the way Python does garbage collection, throwing (perhaps unearned) shade on the fact that Go is _also_ a garbage collected language. Ultimately, the actual literal thought I had was "if I'm gonna learn a compiled language, I may as well learn one that _doesn't_ include a whole runtime and garbage collector in the final binary".
> Disclaimer: I am not today the software engineer I was the better part of a decade ago

## Act 3: Doin' It To 'Em
So, I did it. I took the plunge and learned rust. I was apprehensive, because (at the time) rust had a reputation for being frustrating while you're still on the leftward side of the learning curve. The thing that really wiped all of that away for me though was one of the very first things [the rust book](https://doc.rust-lang.org/book/ch03-01-variables-and-mutability.html#:~:text=Compiler%20errors%20can%20be%20frustrating) has to say about error messages from the compiler:
> Compiler errors can be frustrating, but really they only mean your program isn't safely doing what you want it to do yet; they do not mean that you're not a good programmer!
>
> Experienced Rustaceans still get compiler errors.
That more or less did away with any apprehension I felt about the compiler or the language itself. It almost felt like I'd made a deal with the compiler - "if you'll do what I say, make the changes I suggest, I promise I'll keep your feet safe from landmines and [footguns](https://matt-rickard.com/avoiding-footguns)". Coming from Python, it was just plain reassuring that the compiler wouldn't _let_ me put code out into the world that was just going to throw an error at runtime. I mean, it's still gonna yell, but it's gonna yell _at me_ and it's always gonna do it _before_ I ship something, not halfway through a customer's once-a-night, business-critical reconciliation with our backend.
That was **huge**. Even huger though might be the amount of just plain... _paranoia_ or second-guessing code I could do away with. If you're a long-time, battle-seasoned Python programmer and you've ever had to deal with code that wants to deal with disparate remote systems (or even _one_ remote system that grew -cough- _organically_ vs. intentionally), I'll bet this looks familiar:
```python
def convert(record):
# ...
if isinstance(record.amount, str):
record.amount = convert_strings_to_amounts(record.amount)
elif isinstance(record.amount, float):
record.amount = cast_floats_to_valid_amounts(record.amount)
elif isinstance(record.amount, dict):
record.amount = assemble_amount_from_dict(record.amount)
elif record.amount is None:
raise TypeError(type(record.amount), record.amount, "expected an integer amount in pennies")
if record.amount < 1:
raise ValueError("transactions must have a positive, non-zero total")
# ...
```
A few things here. First, here's the equivalent rust code:
```rust
pub(crate) fn convert(record: RecordFromRemoteSystem) -> Result {
// ...
if record.amount < 1 {
return Err(RecordConversionError("transactions must have a positive, non-zero total"));
}
// ...
}
```
That's right - no guessing, `record.amount` **will** be an integer or the code just won't compile. That's all there is to it. To the Python dev I was 10 years ago, that's 🤯.
Next, taking a look at the Python code again, it's... just not right. The _correct_ version of that (in my opinion) would be something more like:
```python
from dataclasses import dataclass, field
@dataclass
class RecordFromRemoteSystem:
"""A transaction record from {remote system}."""
# ...
amount: int = field(
metadata=dict(
description="The transaction total, in whole pennies",
),
)
# ...
def convert_to_local_record(record: RecordFromRemoteSystem) -> LocalRecord:
"""Convert the supplied record from {remote system} to a record compatible with {local system}."""
# ...
```
> Note: if we want to be even more nitpicky then I'm about to be: yes, you're right, `convert_to_local_record` should be an associated method of the `RecordFromRemoteSystem` class, and it probably should be renamed `to_local_record` or somesuch, but... Rug. Swept. Hush 🤫
See the proper type annotations and docstring? In Python, you can _ask_ devs to do that, you can even do things like configure [pre-commit hooks](https://pre-commit.com/) to try and enforce it, but ultimately there's nothing in the language itself or its "standard" tooling that's going to make it anything other that the equivalent of a "come on guys, I'm super for real, you gotta do this, please".
Here it is in rust:
```rust
#![deny(missing_docs)]
/// A transaction record from {remote system}
pub(crate) struct RecordFromRemoteSystem {
// ...
/// The transaction total, in whole pennies
amount: u32,
// ...
}
impl RecordFromRemoteSystem {
/// Convert a record from {remote system} into a
/// compatible record for {local system}
pub(crate) fn to_local_record(self) -> LocalRecord {
// ...
}
}
```
Not only are the type annotations simply a required part of rust's syntax, all it takes to ensure documentation gets written is that little `#![deny(missing_docs)]` at the top there. Add that, and it suddenly becomes just as much of a compile time violation to not write documentation as it would be to call a function expecting an integer and pass it a string value.
I could probably go on all day with examples, but...
## Happily Ever After\*
> - - terms and conditions apply, only for certain definitions of "happy", not legally binding in the State Of California or geographic areas under the sovereign authority of Victor von Doom
My journey to and through rust is (perhaps obviously) much more than these simple examples, and I wouldn't dream of trying to keep you captive for all of them. For the purposes of the narrative, I will say that the experience of learning rust unquestionably made me a better Python developer. Aside from that though, coming to rust from Python, having experienced a lot of the most common and most _frustrating_ pitfalls in Python means that a large portion of my appreciation for rust is born from the things that just _aren't_ problems in rust the same way they are in Python. By that I mean things that either outright _aren't_ problems in rust, (like "what happens if some ~~idiot~~ _downstream user_ tries to call this function on a string and not an int like it's expecting), or things that aren't the same _caliber_ of problem in rust that they are in Python (like "start documenting your code or I'll break your fingers").
There a thousand and one other little things (like how nice rust's enums are, or how _fluid_ error and option handling are, or just the `match` statement) that rust brings together that help to heal the (admittedly _absolutely self-inflicted_) battle wounds Python development left me with. I'd be lying if I didn't say that working in rust doesn't have its _own_ frustrations, but sitting here now, writing this, I can't think of a single one that I'd hold up as my "if you could tell your younger self one thing" or even "what would you tell someone looking to learn rust". I hate, hate, **hate** to repeat this specific piece of advice simply because I remember how frustratingly hand-wavy it felt when _I_ first read it, but just read the rust book and remember that the compiler is _your friend_ and that when it says "no, you can't do that", it really means "that's not safe, you'll hurt yourself somewhere down the road if I let you do it, so I'm not gonna" and temper any frustration you might feel by remembering that even when it _does_ tell you no, it almost always follows it up with a suggestion of what to do so it can tell you yes instead.
## Shameless Self-Promotion
Full disclosure, I _am_ one of the ~~ancient and unfathomably powerful wizards~~ _humble and dedicated_ engineers on Shuttle's dev team. Even when I wasn't though, I'd still tell anyone who would listen - you should do the CCH challenges. For anyone interested in rust _at all_, if you're just curious, just started, or even if you've been working in rust for years - take an afternoon and work through Shuttle's [Christmas Code Hunt](https://www.shuttle.dev/cch) challenge, even if it's the middle of July when you're reading this. The challenges start off easy, all have multiple ways to solve them _and_ multiple ways to earn points, and cover a truly ridiculous cross section of rust, backend, and web technology in general. They are undeniably an incredibly fun way to learn rust fundamentals, broaden your knowledge of building backend services in general and rust specifically, _and_ you end up with a super cool project you can show off. What's not to love? 😁
---
# Rust as My First Language
Source: https://www.shuttle.dev/blog/2024/08/23/rust-as-my-first-language
Date: 23 August 2024
Author: jeff
Tags: rust, opinion
One Rust developer's story about how they got into Rust.
## Who am I?
I'm an engineer who works in a field that is not related to software development. Computers are in my blood, I've been around them since I was a child. I can code and have danced with many tools over the years, but I'm not even remotely a professional. In the dark days of early COVID, I decided I wanted to learn how to code...really learn. I feel every engineer should know how to, as a means of expressing a solution to a problem. You might not do it every day, but it's a great tool to have in the belt.
Also, the notion of creating something from nothing has always fascinated me. This is what you do when you code, take a less than vague idea and turn it into a purposeful idea.
I set off on a self-taught journey.
## Goals
I didn't start out immediately with this goal, but it's grown over time. I want to be able to make simple services for not only for myself but also the company I work for. I want to do this with an ecosystem that supports me and makes it relatively painless to get things done. I say relatively because there so no such thing as truly painless. Very often, you're picking your pain.
## Why Rust?
As I started writing this piece, I started to feel really foolish. The feeling got worse the more I wrote.
I have no right to use Rust. Quite frankly it's not necessary. I could work in anything that's "easier". Rust is not easy, the learning curve is legendary. The things it brings to the table are maximum overkill for literally anything I might want to create. I could use JavaScript, Go, C#, literally any garbage collected language.
Why Rust indeed.
I began the journey with the intent to sit down and learn C++ once and for all. Much of the world's most flexible software is written with it. I dipped a toe in, completing a very basic course on Codecademy. One thing that I kept thinking as I went along, I'm not smart enough, when the chips are down, to do anything meaningful in C++.
So, if not C++, then...what?
I spent time with vanilla web tech, including pure JavaScript, with a bit of dabbling into React, React Native, and NextJS. The trouble is, I dislike JavaScript...and I don't want to be the billionth person learning the traditional ways. I want to learn, use and advocate for something different. There are too many voices for the traditional tech stacks. I don't want to be part of that. I wanted something different.
Rust came onto my radar in early 2021. I installed it and began investigating. There are several aspects that drew, and continue to draw, me in.
_Rules of the Road_
Rust can go low and it can also go high. What I mean by that is you can get down into the dirt if you want, or you can stay up high with a web framework where someone else has dug in the dirt. The clear rules around memory use were really appealing to me. If I want to roll everything myself, I have a higher chance to create something safe out of the box, leaving me to worry mainly about logic errors. You get the power of C++ without the sleepless nights fretting about memory leaks, race conditions, and other nastiness.
_Tooling_
A struggle with Javascript is layer upon layer of tooling, that you have to cobble together from different places. Newer JavaScript runtimes, such as Bun and Deno, are making strides to solve this, but there's still a level of mental overhead. In Rust land, you have `cargo` as your package manager. Once you start using it, nothing else is good enough. When you leave it, you immediately miss it its coherence.
_Pair Programming_
The Rust compiler is very tough, but in a good way. Out of the box you have an immediate ally and pair programmer sitting beside you. I've learned a lot from it. I miss it when it's gone. `Clippy`, Rust's linter, is ready and waiting too, offering rich, helpful suggestions.
_Testing_
This may be a cliche, but testing is a first-class concept in Rust land. You don't have to do anything special or pull in anything external to write tests. As a new, sole "developer" I need to be diligent and write tests. The fact it's so easy is really appealing.
_The Challenge_
Rust is technically challenging. It presents a terrific puzzle to solve. Yes, it can be frustrating and at times can impede your progress, but the feeling when you get the pieces together is second to none. The feeling when you can just sit down and get some Rust code down to accomplish something is really wonderful.
## My Approach to Learning
_Early Days_
I've always been someone who learns by example. Reading theory and trying to build straight from that has always been a challenge. I get bored quickly just exploring the individual building blocks. I need to see an end goal, then I go about putting together the pieces, breaking them down and gaining insight along the way.
When I started in early 2021, there weren't a lot of learning materials from which to gain context and best practices. I used Medium articles quite a bit, and made my first attempt to get through the Rust Book, which of course, is the consensus starting point. In these early days, the power and point of the type system wasn't quite visible. I found the basics of Rust similar to C, which I knew a little from the past, so this was an early hook.
I did drift away from time to time, as I do suffer from "grass is greener, maybe "X" is easier syndrome", trying out other corners and other languages. However, Rust had made a mark on me and I always kept an eye on it. The promises it brought to the table we too great to overlook.
_Zero to Mastery_
I came to realize I wasn't achieving anything by dancing around. I wanted to get back to Rust. I decided I needed a course, enter [Zero to Mastery](https://zerotomastery.io) and the Rust course by Jayson Lennon. I enrolled in March 2022 and spent the next few months working through his amazing course. It's taught like a beginner programming course, building up from the very basics. I highly recommend it. Jayson is a fantastic teacher. He's very active and supportive on the Zero to Mastery Discord.
_Zero to Production in Rust_
I attempted to work through [Zero to Production](https://www.zero2prod.com) in Rust, by [Luca Palmieri](https://www.lpalmieri.com) before fully completing the Zero to Mastery Rust course. It was a mistake, for two reasons, a) I wasn't ready and b) I rushed too much and didn't focus on the journey. In early 2023, I returned to it again, this time pushing myself to use a different web framework, Axum instead of Actix Web. This turned out to be an excellent move. It was challenging for sure, and admittedly, the unfortunate tendency to rush to the finished "thing" was still there, but it made me think and engage more. I had to start getting acquainted with crate documentation in order to figure out and implement the steps of the project. I highly recommend "ZerotoProd", it's an essential step for new Rustaceans.
_Contributing to Open Source_
Somewhere early in 2023, I discovered [Shuttle](https://www.shuttle.dev). Re-discovered is maybe better, as I as aware of the project since late 2022. Again, I dove in with both feet and started helping with their documentation. In the summer of 2023, I tentatively put my name down to actually work in the Shuttle codebase. I helped implement a few new methods for Shuttle Persist. I felt so stupid, banging my head for hours sometimes, slinging code hoping something would stick. The Shuttle Team was so gracious, quietly coaching and pointing the way. The work I did really helped with some things I was struggling with, chief of which was testing. I had to learn how to write unit tests to support the code I added. I'm sure the Team have re-factored and thrown away what I originally wrote by now, but seeing it committed and in the codebase was a wonderful feeling. Contributing to open source...to something real, was an essential step in the journey. I continue to help with simple things and nurse the desire to, someday, really help with a big new feature.
_Shuttle Christmas Code Hunt_
In December 2023, the Shuttle folks started the first ever "Christmas Code Hunt", in the vein of Advent of Code. In contrast to that, the Shuttle challenges were far more approachable. At first, I thought, I'll add to the challenge by using `Tower`, rather than a higher level web framework. By this time, crate documentation was less mystical to me, and I figured out enough theory that I felt I could get somewhere. I did...mostly. With a bit of kind community help, I completed the first few challenges before dropping off. I intend to return to these challenges in the future.
_Iteration, Diffusion and Consistency_
Overall, iteration and repetition are key to me learning anything, especially Rust. I repeat things, perhaps with small variations, that build muscle memory. I can now organize a project into a binary and library, with modules, effortlessly. Project organization was difficult at first, understanding file and folder boundaries, and how Rust treats them, was a challenge. The material in the Rust Book was abstract for my liking, lacking in specific, practical examples. Once it clicked, it suddenly became very logical.
What I think of as diffusion, or diffuse learning, was important too. You really do have to let your brain absorb and process things over time. It's nice to have little moments where something you struggled with for months suddenly clicks and becomes second nature. This can only happen if you give the brain time to sit back and process.
Consistency is the last piece. I've done something with coding literally almost every single day since I started in late 2020. Don't underestimate how small steps over a long period of time add up to something great.
## Path Forward
I will continue to use Rust wherever I can. My journey with it has been a pleasant challenge. There have been moments of frustration and drift, but I really am enjoying the journey. I haven't made much for myself personally, but am working on using Rust at work. The project I'm most proud of is a sort of "availability tracker" for staff to use that indicates their availability to take on more work. It also lets them show upcoming vacation time, so that others can plan accordingly. I built this app with Actix Web on the backend, which serves up a Tera template for the UI. A Postgres database saves all the information which is displayed by Tera template. I've also embarked on a redo of our office intranet site, which I initially did in React, but going forward it will be done with Yew, which is a very pleasant Rust frontend framework. The project will solidfy my knowledge of form handling and fetching in Yew. I'm also figuring out how to leverage the `wasm-bindgen` crate to step back and forth between Rust and JavaScript.
## Closing Thoughts
I'm no computer scientist or full fledged software developer, I realize the thoughts in this piece are probably a little thin and my rationale for choosing Rust may come across as a little contrived. There are a lot of tools out there and I could have easily picked anything. If Rust didn't exist, I'd probably just be in JavaScript like everyone else, blissfully unaware. However, I'm happy there's a choice. I love that there exists a tool that takes whole classes of bugs off the table and supports me in the desire to create quality, efficient, and safe software.
Although I'm not the most qualified person in the world at Rust programming, I will continue to advocate for its use and adoption. I would encourage anyone interested to dive in head first and carve a unique path.
---
# Why you should use Rust on the backend
Source: https://www.shuttle.dev/blog/2024/07/31/rust-on-the-backend
Date: 31 July 2024
Author: josh
Tags: rust, opinion
What makes Rust worth using for backend web services?
With Rust named most admired language in the Stack Overflow 2024 survey, more and more developers are looking to get into Rust. Though Rust is a versatile language, many newer Rust developers are using it for backend web development in particular. In this article, we'll talk about why Rust makes a good fit for backend web development compared to other languages.
## What does a Rust web service look like?
Before we dive into the benefits of Rust on the backend, let's have a look at what a Rust web service looks like - using Axum as our web framework, for reference.
Below is an example of adding a database pool from `sqlx` to shared application state. We'll use it within a router, with an endpoint for grabbing database records and returning a JSON response:
```rust
use sqlx::PgPool;
use axum::{Router, routing::get};
use tokio::net::TcpListener;
// we auto-implement the Clone trait here so that this struct can be cloned
// by the framework when required for requests
#[derive(Clone)]
struct AppState {
db: PgPool
}
#[tokio::main]
async fn main -> Result<(), Box {
// this assumes we already have our database connection function set up
// using the `?` operator allows us to automatically propagate errors
// without needing to manually handle them or use unwraps
let db = connect_to_db().await?;
let state = AppState { db };
// set up router here
let router = Router::new()
.route("/users", get(get_users))
.with_state(state);
let tcp_listener = TcpListener::bind("localhost:8000").await?;
axum::serve(tcp_listener, router).await?;
Ok(())
}
```
We'll also add our endpoint code below:
```rust
use serde::Serialize;
use axum::{extract::State, response::IntoResponse};
// here we auto-derive the FromRow trait from `sqlx`
// and Serialize from `serde` to serialize our struct into JSON
// as well as automatically converting retrieved Postgres rows into our struct
#[derive(sqlx::FromRow, Serialize)]
struct User {
id: i32,
name: String,
email: String,
}
// here, we've set the function to return a non-concrete type that implements IntoResponse
async fn get_users(State(state): State) -> impl IntoResponse {
let query = sqlx::query_as::<_, User>("SELECT * FROM users")
.fetch_all(&state.db)
.await
.unwrap();
Ok(Json(query))
}
```
While the syntax can be somewhat unfamiliar, idiomatic Rust code is relatively easy to follow. Although we've set up the core of our application logic in the main function, it would be easy to extract it to another function - or indeed another local crate package, for the sake of testing.
## Rust benefits
### Low Memory Footprint
Rust's borrow checker system allows for much lower footprint during runtime. Optimisations made during compilation time allow for a small memory footprint, as well as providing memory safety garuantees. This makes Rust a great language to use for companies (and individuals!) who want to simultaneously up their green credentials and save on running overhead costs. Faster execution speed can also save costs on serverless functions!
This generally matters more for web services than other types of applications. If you're not running your web service on a VPS, chances are you're being billed for compute and CPU usage. Being able to use a much more efficient language for writing backends can significantly reduce costs in the long run, especially for larger companies who may be switching over from something like Java, Python or Ruby. In terms of using a VPS, it would mean you may be able to downsize the VM you're using, constraints notwithstanding.
The other primary consequence of this advantage is that it's far easier to run Rust web servers on IoT devices. For example, running an Actix Web server on a Raspberry Pi. You could technically do that with something like Django, Flask, or even Ruby on Rails. However, chances are with a sufficiently large application that there might not be much room for running anything else. At the very least, you'll be able to run an extra few programs on your small machine which depending on your use case, can be quite useful.
Frontloading so much to the compiler does, of course, increase compilation times. Even so, your application will typically be running for much longer in production. Using [crane](https://github.com/ipetkov/crane) and [mold linker](https://github.com/rui314/mold) can also be used to reduce compilation time significantly. Although first-time compiles can take a few minutes, typically with subsequent compilations it takes much less thereafter.
### Concurrency
Concurrency has always been a difficult problem to solve. Language design choices designed to abstract away complexity can often contribute to this. For example, Python's Global Interpreter Lock (GIL) has undeniably had benefits in terms of development and making it easier to run C extensions in Python. However, it can also significantly increase the complexity of multithreaded applications. This is primarily through lock acquisition and thread contention. As a consequence, things like parallelism can be much more difficult to express.
In contrast, Rust doesn't hide the complexity of writing concurrent programs. This can make it somewhat intimidating to get started. However, the current ecosystem extends the stdlib primitives significantly to provide much more usable abstractions that make handling concurrency much easier at scale. For example: [dashmap](https://docs.rs/dashmap/latest/dashmap/), a concurrent `HashMap` implementation, as well as [parking-lot](https://github.com/Amanieu/parking_lot) which primarily provides the parking and unparking of threads but provides deadlock detection for mutexes and other synchronization primitives.
If you're using the Tokio runtime for async Rust, it's also easy to use Tokio's synchronisation primitives which can be used across threads. If you want basic concurrency in a Rust backend service without going the whole way, making use of the primitives can be a great way to implement this:
```rust
use std::sync::Arc;
use tokio::sync::RwLock;
use std::collections::HashMap;
#[tokio::main]
async fn main() {
let locked_map: Arc>> = Arc::new(RwLock::new(HashMap::new()));
let mut writer = locked_map.write().await.unwrap();
writer.insert("Hello".to_string(), "world!".to_string());
// manually drop the Writer lock here so we can get access back
drop(writer);
let reader = locked_map.read().await.unwrap();
println!("{}", reader.get("Hello".to_string()));
}
```
**The difference between Rust and other languages is in the implementation detail.** Because of Rust's type system (RwLocks and Mutexes wrap types, for example), synchronization primitives don't lock threads - they lock resources. This is an important detail because it still allows other things to run. Locks are also scoped: once the function runs and it's out of scope, the lock automatically drops and gets destroyed allowing you to lock the resource again. In other languages like C++, the mutex is itself a resource that locks the whole thread, which itself can cause issues. One easy example of such an issue is forgetting to unlock a mutex, or an improper locking order. Of course, this doesn't mean Rust is immune to race conditions - resources can still get locked from attempted simultaneous access as well as lock poisoning and similar issues.
Entire programming languages have been dedicated to dealing with concurrency: Erlang with BEAM (and any other languages that can run on the BEAM VM) being one example. Although Rust doesn't quite have concurrency baked in every single language design choice, if you wanted to make a fully concurrent section of your backend web service in Rust, you're given the tools to be able to do it safely and efficiently for backend Rust web services.
### Memory Safety
Earlier this year, [the White House advocated for memory safe languages](https://www.whitehouse.gov/wp-content/uploads/2024/02/Final-ONCD-Technical-Report.pdf) which is a huge win for Rust. Although Rust was one of several languages in the discussion, the message is largely the same: move away from languages that don't have sufficient safeguards around introducing memory errors, whether they're memory access violations or leaks (or a simple use-after-free!).
Rust is not entirely immune to memory issues. However, it does leverage sufficient safeguards such that you need to deliberately use the `unsafe` marker to bypass the forced memory safety garuantees of the compiler. For example, this code which is a method in the vector type (`Vec`) for removing an element at a given index:
```rust
pub fn remove(&mut self, index: usize) -> T {
// Note: `<` because it's *not* valid to remove after everything
assert!(index < self.len, "index out of bounds");
unsafe {
self.len -= 1;
let result = ptr::read(self.ptr.as_ptr().add(index));
ptr::copy(
self.ptr.as_ptr().add(index + 1),
self.ptr.as_ptr().add(index),
self.len - index,
);
result
}
}
```
Note that the function is "safe" to use because it's not marked unsafe, but there is an unsafe block. This means that it's up to the library to ensure the code soundness rather than the user!
While this can be intimidating for many, many libraries solve this issue by creating safe abstractions for unsafe code by using the above methodology. A specific example of this would also be the many libraries that are Rust bindings to C libraries. They have safe abstractions on top (like `image-rs` and `rust-rdkafka`), allowing users to safely use the underlying tech without memory issues. Many parts of the standard library also use unsafe code, with the synchronization examples and low-level data structures like `Vec` (vectors) and hashmaps. [The Rustonomicon](https://doc.rust-lang.org/nomicon/intro.html) actually has a guide for [re-implementing the `Vec` type from scratch](https://doc.rust-lang.org/nomicon/vec/vec.html), which is a great read for anyone who wants to dive deeper into using unsafe Rust safely.
Although memory safety is not explicitly a hard requirement for most industries and use cases, memory issues are often time-consuming to resolve and can be quite costly if it's related to infrastructure. As it stands, for most developers making a memory error is practically inevitable - which is why adding compile-time checks for memory safety is an important advantage that Rust holds. Of course, there are things that get past the compiler, but if you're in a team with more junior engineers, you definitely don't want them to be shipping memory errors into production. Rust makes it much easier to ensure that it doesn't happen.
## Who's using Rust?
Of course, Rust is currently being used by quite a few large companies: Amazon, Google and Microsoft (who is [in the process of migrating their Office 365 backends to Rust](https://securityboulevard.com/2024/02/microsoft-365-rust-richixbw/)) to name a few. Many companies who are also security-oriented also use Rust: [1Password](https://1password.com/) who have [made their own collection of Rust libraries for using passkeys](https://github.com/1Password/passkey-rs), [cryptee](https://crypt.ee/) who focus on encrypted document storage and photo management services, as well as the growing number of Rust companies and consultancies that are popping up to help larger companies with creating quality Rust code.
[DARPA](https://www.darpa.mil/) also recently announced that they are [converting all of their C code to Rust](https://sam.gov/opp/1e45d648886b4e9ca91890285af77eb7/view) with the goal of the codebase eventually as high quality as would be from skilled Rust developers. While no small undertaking, if done successfully this will be a huge win for Rust going forward.
Though it should come as no surprise, at Shuttle we also use Rust! Our platform services as well as our CLI are written in 100% Rust, and you can see this by going to [our main repository.](https://www.github.com/shuttle-hq/shuttle)
## Finishing up
Thanks for reading! Although there's a lot of reasons to use Rust on the backend, hopefully this article has helped you understand some of the underlying details behind the advantages.
Read more:
- [Getting started with Actix Web](https://www.shuttle.dev/blog/2023/12/15/using-actix-rust)
- [An intro to advanced Rust traits and generics](https://www.shuttle.dev/blog/2024/04/18/using-traits-generics-rust)
- [Why type safety is important](https://www.shuttle.dev/blog/2023/11/29/type-safety)
---
# ShuttleAI: Build & Deploy AI-Powered Web Services from a Single Prompt
Source: https://www.shuttle.dev/blog/2024/07/18/ai-apps-from-a-single-prompt
Date: 18 July 2024
Author: ivan
Tags: shuttle, shuttle-ai
At Shuttle, we've been working on a new tool that we think could change how developers approach AI integration. We're calling it ShuttleAI, and it allows you to build and deploy AI-powered web services from a single prompt.
At Shuttle, we've been working on a new tool that we think could change how developers approach AI integration. We're calling it ShuttleAI, and it allows you to build and deploy AI-powered web services from a single prompt.
Here's the TL;DR:
- Describe your AI service in plain language
- ShuttleAI generates a project spec for you to review
- Approve or modify the spec
- ShuttleAI creates the project files
- You can prompt for changes or deploy
It's that simple. But let's dig into the details.
## The Problem: AI Integration is Hard
If you've ever tried to integrate AI into a web service, you know it's not trivial. Here are some common challenges:
1. **Complexity**: AI frameworks often require specialized knowledge.
2. **Time**: Setting up AI services can take weeks or months.
3. **Infrastructure**: Managing AI models needs robust, scalable infrastructure.
4. **Ongoing maintenance**: AI services require continuous monitoring and updates.
These barriers can be significant, especially for smaller teams or developers new to noisy AI space.
## How ShuttleAI Works
ShuttleAI aims to simplify this process dramatically. Here's a step-by-step breakdown:
1. **Describe Your Service**: You provide a prompt describing the AI service you want to build. For example:
```
"Build a web service that takes weather forecast data and user profiles as input, then returns personalized weather recommendations."
```
2. **Review the Spec**: ShuttleAI generates a project specification document in markdown. This includes:
- API endpoints
- Data models
- AI model selection
- Infrastructure requirements
You can review and modify this spec as needed.
3. **Generate Project Files**: Once you approve the spec, ShuttleAI creates all necessary project files. This includes:
- Backend code (eg. Python with Flask)
- AI model integration code
- Infrastructure in the form of [Infrastructure from Code](https://docs.shuttle.dev/introduction/how-shuttle-works)
4. **Iterative Refinement**: You can prompt ShuttleAI to make changes at this stage. For example:
```
"Add rate limiting to the API endpoints"
```
ShuttleAI will update the project files accordingly.
5. **Deploy**: Once you're satisfied, ShuttleAI compiles and deploys your project on the Shuttle platform.
## Use Cases
We're excited to see what developers will build with ShuttleAI. Here are a few ideas we've been thinking about:
1. **Personalized Content Engines**: Analyze user behavior and content metadata to provide tailored recommendations.
2. **Intelligent Data Processing**: Create services that clean, normalize, and enrich data using AI.
3. **Natural Language Interfaces**: Build APIs that can understand and respond to natural language queries.
4. **Predictive Analytics Services**: Develop APIs that forecast trends based on historical data.
## Beta Testing and Early Access
ShuttleAI is still in development, and we're looking for beta testers. If you're interested in being one of the first to try it out, we're offering early access to the first 100 developers who sign up for our waitlist.
As a beta tester, you'll get:
- Early access to ShuttleAI
- Direct support from our development team
- The opportunity to shape the future of the tool
[Click here to sign up for early access!](https://www.shuttle.dev/ai)
## What's Next?
We're continuously working on improving ShuttleAI. Some features we're exploring for future releases:
- Support for more AI models and APIs
- Advanced customization options for generated services
- A marketplace for sharing and deploying AI service templates
## We Want Your Feedback
ShuttleAI is still evolving, and we want to build it in a way that truly serves developers' needs. If you have ideas, questions, or concerns, we want to hear them.
Drop us a line at [hello@shuttle.rs](mailto:hello@shuttle.rs) or open an issue in our [GitHub repo](https://github.com/shuttle-hq/shuttle).
Remember, the first 100 signups get early access to the beta. Don't miss out on the chance to shape the future of AI service development!
[Click here to sign up for early access!](https://www.shuttle.dev/ai)
---
# A Comprehensive Guide to the llm-chain Rust crate
Source: https://www.shuttle.dev/blog/2024/06/06/llm-chain-langchain-rust
Date: 6 June 2024
Author: josh
Tags: rust, ai, llm-orchestration, guide
Deep diving into the llm chain crate and leveraging Rust's version of Langchain
LLM orchestration is an important part of creating AI powered applications. Particularly in business use cases, AI agents and RAG pipelines are commonly utilised for refined LLM responses. Although Langchain is currently the most popular LLM orchestration suite, there are also similar crates in Rust that we can use. In this article, we'll be diving into one of them - `llm-chain`.
## What is llm-chain?
`llm-chain` is a collection of crates that describes itself as "the ultimate toolbox" for working with Large Language Models (LLMs) to create AI-powered applications and other tooling.
You can find the crate's GitHub repository [here.](https://github.com/sobelio/llm-chain)
### Comparison to other LLM orchestration crates
If you've looked around for different crates, you probably noticed that there are a few crates for LLM orchestration in Rust:
- `llm-chain` (this one!)
- `langchain-rust`
- `anchor-chain`
In comparison to the others, `llm-chain` is somewhat macro heavy. However, it is also the most developed in terms of having extra data processing utilities. If you're looking for an all-in-one package, `llm-chain` is the crate that's most likely to help you get over the line. They also have [their own docs.](https://docs.llm-chain.xyz/docs/introduction)
## Getting Started
### Pre-requisites
Before you add `llm-chain` to your project, make sure you have access to the prompting model you want to use. For example, if you want to use OpenAI, make sure you have an OpenAI API key (set as `OPENAI_API_KEY` in environment variables).
### Setup
To get started, all you need to do is to add the crate to your project (as well as Tokio for async):
```bash
cargo add llm-chain
cargo add tokio -F full
```
Next, we'll want to add a provider for whatever method of model prompting you want to use. Here we'll add the OpenAI integration by adding the crate to our application:
```bash
cargo add llm-chain-openai
```
Note that a full list of integrations can be found [here](https://github.com/sobelio/llm-chain/tree/main/crates), split by package.
## Basic usage
### Prompting
To get started with `llm-chain`, we can use their basic example as a way to quickly get something working. In this code snippet, we will:
- Initialise an executor using `executor!()`
- Use `prompt!()` with the system message and prompt to store both in a struct that will get used when the prompt (or chain) gets ran.
- Runs the prompt and returns the results, using a reference to the executor.
- Prints the results.
```rust
use std::error::Error;
use llm_chain::{executor, parameters, prompt};
#[tokio::main]
async fn main() -> Result<(), Box> {
let exec = executor!()?;
let res = prompt!(
"You are a robot assistant for making personalized greetings",
"Make a personalized greeting for Joe"
)
.run(¶meters!(), &exec)
.await?;
println!("{}", res);
Ok(())
}
```
Running this prompt should yield a result that looks like this:
```bash
Assistant: Hello Joe! I hope you're having a fantastic day filled with joy and success. Remember to keep shining bright and making a positive impact wherever you go. Have a great day!
```
The default model for the `llm_chain_openai` executor is `gpt-3.5-turbo`. The executor parameters can be defined in the macro - you can also find more about this [here](https://docs.rs/llm-chain/latest/llm_chain/macro.executor.html).
### Using Templates
However, if we want to move onto more advanced pipelines the easiest way for us to do this would be to use a prompt template with parameters. You can see below that much like in the previous code snippet, we generate an executor and return the results. However, instead of using `prompt!()` by itself we use it in `Step::for_prompt_template` - which you can find more about [here](https://docs.rs/llm-chain/latest/llm_chain/step/struct.Step.html).
```rust
use llm_chain::step::Step;
#[tokio::main]
async fn main() -> Result<(), Box> {
let exec = executor!()?;
let step = Step::for_prompt_template(prompt!(
"You are a bot for making personalised greetings",
"Make a personalized greeting tweet for {{text}}"
));
let step_results = step.run(¶meters!("Emil"), &exec).await?;
println!("step_results: {step_results}");
let immediate_results = step_results.to_immediate().await?.as_content();
println!("immediate results: {immediate_results}");
Ok(())
}
```
The results of the output should look like this:
```bash
step_results: Assistant: "Hey @Emil! Wishing you a fantastic day filled with joy, success, and lots of smiles! Keep shining bright and making a positive impact in the world. Cheers to you! 🌟 #YouGotThis"
immediate results: Assistant: "Hey @Emil! Wishing you a fantastic day filled with joy, success, and lots of smiles! Keep shining bright and making a positive impact in the world. Cheers to you! 🌟 #YouGotThis"
```
## Chaining prompts
Of course, one of the main reasons why we're using Langchain (or Langchain-like libraries) in the first place is to be able to orchestrate our LLM usage. The `llm-chain` Rust crate assists us with this by letting us create chains of LLM prompts using the `Chain` struct.
There are three types of chains that we can use with `llm-chain`:
- Sequential chains, which apply steps sequentially
- Map-reduce chains, which use a "map" step to apply to each chunk from a loaded file and then reduce the text. This is quite useful for text summarization.
- Conversational chains, which keep track of the conversation history and manage context. Conversational chains are great for chatbot applications, multi-step interactions and other places where context is essential.
### Sequential chaining
The easiest to use type of chaining is sequential chaining, which simply pipes the output from each step into the next step. When creating our steps, we will use the `Chain` struct instead of creating each step individually:
```rust
use llm_chain::step::Step;
use llm_chain::chains::sequential::Chain;
use llm_chain::prompt;
// Create a chain of steps with two prompts
let first_step = Step::for_prompt_template(
prompt!("You are a bot for making personalized greetings", "Make personalized birthday e-mail to the whole company for {{name}} who has their birthday on {{date}}. Include their name")
);
// Second step: summarize the email into a tweet. Importantly, the text parameter is the result of the previous prompt.
let second_step = Step::for_prompt_template(
prompt!( "You are an assistant for managing social media accounts for a company", "Summarize this email into a tweet to be sent by the company, use emojis if you can. \\n--\\n{{text}}")
);
let chain: Chain = Chain::new( vec![first_step, second_step] );
```
Next, we'll then use the `parameters!` macro to inject parameters into the prompt pipeline:
```rust
use llm_chain::parameters;
use llm_chain::traits::Executor as ExecutorTrait;
use llm_chain_openai::chatgpt::Executor;
// Create a new ChatGPT executor with the default settings
let exec = Executor::new()?;
// Run the chain with the provided parameters
let res = chain
.run(
// Create a Parameters object with key-value pairs for the placeholders
parameters!("name" => "Emil", "date" => "February 30th 2023"),
&exec,
)
.await?;
// Print the result to the console
println!("{}", res.to_immediate().await?.as_content());
Ok(())
}
```
Running the code should yield a result that looks like this:
```bash
Assistant: 🎉🎂 Join us in celebrating Emil's birthday on February 30th! 🎈🎁 Emil, your dedication and hard work are truly commendable. Wishing you happiness and success on your special day! 🥳🎉 #HappyBirthdayEmil #TeamAppreciation 🎂
```
### Map-reduce chains
Map-reduce chains typically consist of two steps:
- A "Map" step that takes a document and applies an LLM chain to it, treating the output as a new document
- The new documents are then passed to a new chain that combines the separate documents to get a single output.
At the end of a Map-Reduce chain, the output can be taken for further processing by sending it to another prompting model (for instance) or as part of a sequential pipeline.
To use this pattern, we need to create a prompt template:
```rust
// note that we import Chain from a different module here!
use llm_chain::chains::map_reduce::Chain;
// Create the "map" step to summarize an article into bullet points
let map_prompt = Step::for_prompt_template(prompt!(
"You are a bot for summarizing wikipedia articles, you are terse and focus on accuracy",
"Summarize this article into bullet points:\\n{{text}}"
));
// Create the "reduce" step to combine multiple summaries into one
let reduce_prompt = Step::for_prompt_template(prompt!(
"You are a diligent bot that summarizes text",
"Please combine the articles below into one summary as bullet points:\\n{{text}}"
));
// Create a map-reduce chain with the map and reduce steps
let chain = Chain::new(map_prompt, reduce_prompt);
```
Next, we need to take some text from a file and add it as a parameter - the `{{text}}` parameter in the Map prompt will automatically take in the file content:
```rust
// Load the content of the article to be summarized
let article = include_str!("article_to_summarize.md");
// Create a vector with the Parameters object containing the text of the article
let docs = vec![parameters!(article)];
let exec = executor!()?;
// Run the chain with the provided documents and an empty Parameters object for the "reduce" step
// Note that there are multiple modules with a Chain struct
// This one takes two different modules for
let res = chain.run(docs, Parameters::new(), &exec).await?;
// Print the result to the console
println!("{}", res.to_immediate().await?.as_content());
```
Note here that because we have **two** steps, the `chain.run()` function will take two different vectors - one for each step, in order. This means that we are passing the article content to the first prompt, but no parameters to the second document.
### Conversational Chains
Of course, the last chain we need to talk about is conversational chains. In a nutshell, conversational chains allow you to load context from memory by using saved chat history. In situations where the platform or model cannot access saved chat history, you might store the response and then use it as extra context in the next message.
To use conversational chains, like before, we need to create a `Chain` (now imported from the conversation module) and define the steps for it:
```rust
use llm_chain::{
chains::conversation::Chain, executor, output::Output, parameters, prompt, step::Step,
};
let exec = executor!()?;
let mut chain = Chain::new(
prompt!(system: "You are a robot assistant for making personalized greetings."),
)?;
// Define the conversation steps.
let step1 = Step::for_prompt_template(prompt!(user: "Make a personalized greeting for Joe."));
let step2 =
Step::for_prompt_template(prompt!(user: "Now, create a personalized greeting for Jane."));
let step3 = Step::for_prompt_template(
prompt!(user: "Finally, create a personalized greeting for Alice."),
);
let step4 = Step::for_prompt_template(prompt!(user: "Remind me who did we just greet."));
```
Next, we will individually send each prompt to the `Chain` in turn, printing out the response from each one. Note that at step 4, we should receive an answer that includes the names of the previous three people we just made a personalized greeting for (Joe, Jane and Alice).
```rust
// Execute the conversation steps.
let res1 = chain.send_message(step1, ¶meters!(), &exec).await?;
println!("Step 1: {}", res1.to_immediate().await?.primary_textual_output().unwrap());
let res2 = chain.send_message(step2, ¶meters!(), &exec).await?;
println!("Step 2: {}", res2.to_immediate().await?.primary_textual_output().unwrap());
let res3 = chain.send_message(step3, ¶meters!(), &exec).await?;
println!("Step 3: {}", res3.to_immediate().await?.primary_textual_output().unwrap());
let res4 = chain.send_message(step4, ¶meters!(), &exec).await?;
println!("Step 4: {}", res4.to_immediate().await?.primary_textual_output().unwrap());
```
Running this should get an output that looks something like this:
```bash
Step 1: Hello, Joe! I hope you are having a fantastic day filled with positivity and joy. Keep shining bright and making a difference in the world with your unique presence. Wishing you continued success and happiness in all that you do!
Step 2: Hello, Jane! Sending you warm greetings and positive vibes today. May your day be as wonderful and vibrant as you are. Remember to keep being your amazing self and always believe in the incredible things you are capable of achieving. Wishing you endless happiness and success in all your endeavors!
Step 3: Hello, Alice! I hope this message finds you well and thriving. You are such a remarkable individual with a heart full of kindness and a spirit full of strength. Keep inspiring those around you with your grace and resilience. May your day be filled with love, laughter, and countless blessings. Stay amazing, Alice!
Step 4: We just created personalized greetings for Joe, Jane, and Alice.
```
## Using embeddings with llm-chain
In terms of using embeddings with `llm-chain`, it provides a helper method for using Qdrant as a vector store. It abstracts over the `qdrant_client` crate, providing an easy way to embed documents and carry out similarity search. Note that the `Qdrant` struct will assume your collection(s) that you want to use have already been created!
### Basic usage
While we can use `qdrant_client` to manually create our own embeddings, `llm-chain` also has an integration for easy access. We will be required to create our own client through `qdrant_client` - which we can then use with the `Qdrant` struct to be able to parse stuff.
First, let's define a couple of passages that we want to insert into our Qdrant collection:
```rust
const DOC_DOG_DEF: &str = r#"The dog (Canis familiaris[4][5] or Canis lupus familiaris[5]) is a domesticated descendant of the wolf. Also called the domestic dog, it is derived from the extinct Pleistocene wolf,[6][7] and the modern wolf is the dog's nearest living relative.[8] Dogs were the first species to be domesticated[9][8] by hunter-gatherers over 15,000 years ago[7] before the development of agriculture.[1] Due to their long association with humans, dogs have expanded to a large number of domestic individuals[10] and gained the ability to thrive on a starch-rich diet that would be inadequate for other canids.[11]
The dog has been selectively bred over millennia for various behaviors, sensory capabilities, and physical attributes.[12] Dog breeds vary widely in shape, size, and color. They perform many roles for humans, such as hunting, herding, pulling loads, protection, assisting police and the military, companionship, therapy, and aiding disabled people. Over the millennia, dogs became uniquely adapted to human behavior, and the human-canine bond has been a topic of frequent study.[13] This influence on human society has given them the sobriquet of "man's best friend"."#;
const DOC_WOODSTOCK_SOUND: &str = r#"Sound for the concert was engineered by sound engineer Bill Hanley. "It worked very well", he says of the event. "I built special speaker columns on the hills and had 16 loudspeaker arrays in a square platform going up to the hill on 70-foot [21 m] towers. We set it up for 150,000 to 200,000 people. Of course, 500,000 showed up."[48] ALTEC designed marine plywood cabinets that weighed half a ton apiece and stood 6 feet (1.8 m) tall, almost 4 feet (1.2 m) deep, and 3 feet (0.91 m) wide. Each of these enclosures carried four 15-inch (380 mm) JBL D140 loudspeakers. The tweeters consisted of 4x2-Cell & 2x10-Cell Altec Horns. Behind the stage were three transformers providing 2,000 amperes of current to power the amplification setup.[49][page needed] For many years this system was collectively referred to as the Woodstock Bins.[50] The live performances were captured on two 8-track Scully recorders in a tractor trailer back stage by Edwin Kramer and Lee Osbourne on 1-inch Scotch recording tape at 15 ips, then mixed at the Record Plant studio in New York.[51]"#;
```
The `Qdrant` struct will automatically assume you have your collection set up and have a `QdrantClient` that already exists, along with the collection name. We'll pass these as arguments into a new function that does the following:
- Create embeddings using `llm-chain-openai`
- Insert the embeddings into Qdrant
- Conduct a similarity search using the prompt
Firstly, we'll want to define a method for creating our `Qdrant` struct so that we can re-use it later on:
```rust
use llm_chain_openai::embeddings::Embeddings;
use llm_chain_qdrant::Qdrant;
use llm_chain::schema::EmptyMetadata;
use qdrant_client::prelude::{QdrantClient, QdrantClientConfig};
// note that the URL must connect to port 6334 - qdrant_client uses GRPC!
// feel free to replace this wit
async fn create_qdrant_client(url: String) -> QdrantClient {
let mut config = QdrantClientConfig::from_url(url);
// this part is only required if you're running Qdrant on the cloud
// if running locally, no api key is required
config.api_key = std::env::var("QDRANT_API_KEY").ok();
QdrantClient::new(Some(config))
}
async fn create_qdrant_struct(qdrant_client: QdrantClient, collection_name: String) -> Qdrant {
let embeddings = Embeddings::default();
// Storing documents
Qdrant::new(
qdrant_client,
collection_name,
embeddings,
None,
None,
None,
)
}
```
Next, we can use the `Qdrant` struct to carry out a similarity search! We'll add our documents to our collection, then conduct a similarity search and print out the stored documents:
```rust
async fn similarity_search_qdrant(qdrant: Qdrant) -> Result<(), Box> {
// embed and upsert the documents into Qdrant
let doc_ids = qdrant
.add_documents(
vec![
DOC_DOG_DEF.to_owned(),
DOC_WOODSTOCK_SOUND.to_owned(),
]
.into_iter()
.map(Document::new)
.collect(),
)
.await?;
println!("Documents stored under IDs: {:?}", doc_ids);
// conduct similarity search and find similar vectors
let response = qdrant
.similarity_search(
"Sound engineering is involved with concerts and music events".to_string(),
1,
)
.await?;
// print out the stored documents with payload, embeddings etc
println!("Retrieved stored documents: {:?}", response);
}
```
After this, we can then send it into a `Chain` or whatever else we need.
### Usage within a prompt template
In isolation, the Qdrant struct is not particularly helpful and mainly provides convenience methods for embedding things. However, we can also add it as part of a `ToolCollection` which lets the pipeline know that it is able to use embeddings.
```rust
let qdrant = create_qdrant_struct( ,
"mycollection".to_string()).await;
let exec = executor!().unwrap();
let mut tool_collection = ToolCollection::::new();
tool_collection.add_tool(
QdrantTool::new(
qdrant,
"factual information and trivia",
"facts, news, knowledgebuild_local_qdrant().await; or trivia",
)
.into(),
);
let task = "Tell me something about dogs";
let prompt = ChatMessageCollection::new()
.with_system(StringTemplate::tera(
"You are an automated agent for performing tasks. Your output must always be YAML.",
))
.with_user(StringTemplate::combine(vec![
tool_collection.to_prompt_template().unwrap(),
StringTemplate::tera("Please perform the following task: {{task}}."),
]));
let result = Step::for_prompt_template(prompt.into())
.run(¶meters!("task" => task), &exec)
.await
.unwrap();
println!("{}", res.to_immediate().await?.as_content());
```
## Processing data using llm-chain
While `llm-chain` provides tooling for creating LLM pipelines, another important part of Langchain and libraries like it is being able to process and transform data. Prompts (and prompt engineering) are important to get right. However if we're also feeding data into our pipeline, we'll also want to make sure it's as easy as possible to find the most relevant context.
Below are a couple of useful use cases that you may want to check out.
### Scraping search results
`llm-chain` provides a convenience struct for scraping Google Results using the `GoogleSerper` struct - using the Serper.dev service.
```rust
use llm_chain::tools::{tools::GoogleSerper, Tool};
#[tokio::main(flavor = "current_thread")]
async fn main() {
let serper_api_key = std::env::var("SERPER_API_KEY").unwrap();
let serper = GoogleSerper::new(serper_api_key);
let result = serper
.invoke_typed(&"Who was the inventor of Catan?".into())
.await
.unwrap();
println!("Best answer from Google Serper: {}", result.result);
}
```
As well as this, there is also support for Bing Search API which provides 1000 free searches a month. Below is a code snippet of how you can use the API:
```rust
use llm_chain::tools::{tools::BingSearch, Tool};
#[tokio::main(flavor = "current_thread")]
async fn main() {
let bing_api_key = std::env::var("BING_API_KEY").unwrap();
let bing = BingSearch::new(bing_api_key);
let result = bing
.invoke_typed(&"Who was the inventor of Catan?".into())
.await
.unwrap();
println!("Best answer from bing: {}", result.result);
}
```
Should you need to change between one or the other, both are quite easy to use.
### Extracting labelled text
`llm-chain` also has some convenience methods for extracting labelled text. If you have a string of bullet points for instance, you can use `extract_labeled_text()` to be able to extract the text.
```rust
use llm_chain::parsing::extract_labeled_text;
fn main() {
let text = r"
- Title: The Matrix
- Actor: Keanu Reeves
- Director: The Wachowskis
";
let result = extract_labeled_text(text);
println!("{:?}", result);
}
```
Running this code should result in an output that looks like this:
```bash
[("Title", "The Matrix"), ("Actor", "Keanu Reeves"), ("Director", "The Wachowskis")]
```
You can find out more about the `parsing` module for `llm-chain` [here](https://docs.rs/llm-chain/latest/llm_chain/parsing/index.html) as well as [some of the examples](https://github.com/sobelio/llm-chain/tree/main/crates/llm-chain/examples).
## Conclusion
Thanks for reading! With the power of `llm-chain`, you can easily leverage AI for your applications.
Read more:
- [Building a RAG agent workflow](https://www.shuttle.dev/blog/2024/05/23/building-agentic-rag-rust-qdrant)
- [Using Huggingface with Rust](https://www.shuttle.dev/blog/2024/05/01/using-huggingface-rust)
- [Building an Axum web server to use with llm-chain](https://www.shuttle.dev/blog/2024/03/13/simple-web-server-rust)
---
# Implementing Semantic Caching with Qdrant & Rust
Source: https://www.shuttle.dev/blog/2024/05/30/semantic-caching-qdrant-rust
Date: 30 May 2024
Author: josh
Tags: rust, ai, rag, guide
Using semantic caching for RAG in a Rust web service context and deploying it
Hello world! Today we're going to learn about semantic caching with Qdrant, in Rust. By the end of this tutorial, you'll have a Rust application that can do the following:
- Ingest a CSV file, turn it into an embedding with the help of an LLM and insert it into Qdrant
- Create two collections in Qdrant - one for regular usage and one for caching
- Utilize semantic caching for quicker access
Interested in deploying or got lost and want to find a repository with the code? You can find that [here](https://github.com/joshua-mo-143/shuttle-qdrant-semantic-caching)
## What is semantic caching, and why use it?
In a regular data cache, we store information to enable faster retrieval later on. For example, you might have in a web service that's served behind Nginx. We can have Nginx cache either all responses, or only the most accessed endpoints. This improves performance and reduces load on your web server.
Semantic caching in this regard is quite similar. Using vector databases, we can create database collections that store the queries themselves. For example, these two questions semantically carry the same meaning:
- What are some best practices for writing the Rust programming language?
- What are some best practices for writing Rustlang?
We can store a copy of the query in a cache collection, with the answer as a JSON payload. If users then ask a similar question, we can retrieve the embedding and fetch the answer from the payload. This avoids us having to use an LLM to get our answer.
There are a couple of benefits to semantic caching:
- Prompts that require long responses can see serious cost savings.
- It's pretty easy to implement and fairly cheap - the only cost is in storage and using the embedding model
- You can use a cheaper model than your regular embedding
Semantic caching is normally used with RAG - Retrieval Augmented Generation. RAG is a framework to allow context retrieval from pre-embedded materials. For example, CSV files or documents can be turned into embeddings using models and stored in a database. Whenever a user wants to find similar documents to a given prompt, they embed the prompt and search against it in a given database.
Of course, there are good reasons **not** to use semantic caching. Prompts that need differing, varied answers won't find any use for semantic caching. This is particularly relevant in generative AI usage. Fetching a stored query will reduce the creativity of the response. Regardless, if part of your pipeline is able to capitalise on semantic caching, it's a good idea to do so.
## Project setup
### Getting started
To get started, don't forget to use `shuttle init`, with the Axum framework. We'll install our dependencies using the shell snippet below:
```bash
cargo add qdrant-client@1.7.0 anyhow async-openai serde serde-json \
shuttle-qdrant uuid -F uuid/v4,serde/derive
```
You can find our quickstart docs [here.](https://docs.shuttle.dev/getting-started/quick-start)
### Setting up secrets
To set up our secrets, we'll use a `Secrets.toml` file located in our project root (you will need to create this manually). You can then add whatever secrets you need using the format below:
```toml
OPENAI_API_KEY = ""
QDRANT_URL = ""
QDRANT_API_KEY = ""
```
## Setting up Qdrant
### Creating collections
Now that we can get started, we will add some more general methods for creating a regular collection as well as a cache collection, to simulate a real-world scenario (as well as a `new()` function to make creating the `RAGSystem` struct itself). We'll create the struct first: Note here that although we're using vectors with 1536 dimensions, the number of dimensions you'll need may depend on the model you are using.
```rust
use qdrant_client::prelude::QdrantClient;
use async_openai::{config::OpenAIConfig, Client};
struct RagSystem {
qdrant_client: QdrantClient,
openai_client: Client
}
static REGULAR_COLLECTION_NAME: &str = "my-collection";
static CACHE_COLLECTION_NAME: &str = "my-collection-cached";
impl RAGSystem {
fn new(qdrant_client: QdrantClient) -> Self {
let openai_api_key = env::var("OPENAI_API_KEY").unwrap();
let openai_config = OpenAIConfig::new()
.with_api_key(openai_api_key)
.with_org_id("qdrant-shuttle-semantic-cache");
let openai_client = Client::with_config(openai_config);
Self {
openai_client,
qdrant_client,
}
}
}
```
Now we'll create the methods for initialising our regular collection. Note that we'll only need to use these once. After the collections have already been created, if we try to initialise them again we'll get an error.
```rust
use qdrant_client::prelude::CreateCollection;
use qdrant_client::qdrant::{
vectors_config::Config,VectorParams,
VectorsConfig, WithPayloadSelector,
};
impl RagSystem {
async fn create_regular_collection(&self) -> Result<()> {
self.qdrant_client
.create_collection(&CreateCollection {
collection_name: REGULAR_COLLECTION_NAME.to_string(),
vectors_config: Some(VectorsConfig {
config: Some(Config::Params(VectorParams {
size: 1536,
distance: Distance::Cosine.into(),
..Default::default()
})),
}),
..Default::default()
})
.await?;
Ok(())
}
}
```
Next, we'll create our cache collection. When creating this collection, note that we use `Distance::Euclid` instead of `Distance::Cosine`. Both of these can be defined as follows:
- `Distance::Cosine` (or "cosine similarity") measures how closely two vectors are pointing in the same direction. If we plot two vectors on a graph, for example, a vector located at [2,1] would be much closer to [1,1] than it would be [-1, -2]. Cosine similarity is overwhelmingly used in measuring document similarity in text analysis.
- `Distance::Euclid` (or "Euclidean distance") measures how closely two vectors are from each other - i.e., the distance from A to B where A and B are two points on a graph. Rather than trying to determine similarity, here we want to determine whether something is mostly or exactly the same.
```rust
impl RagSystem {
async fn create_cache_collection(&self) -> Result<()> {
self.qdrant_client
.create_collection(&CreateCollection {
collection_name: CACHE_COLLECTION_NAME.to_string(),
vectors_config: Some(VectorsConfig {
config: Some(Config::Params(VectorParams {
size: 1536,
distance: Distance::Euclid.into(),
hnsw_config: None,
quantization_config: None,
on_disk: None,
..Default::default()
})),
}),
..Default::default()
})
.await?;
Ok(())
}
}
```
### Creating embeddings
Next, we need to create an embedding from a file input - using a CSV file as an example. To do so, we'll need to do the following:
- Read the file inputs and parse it to a string (`std::fs::read_to_string()` parses to a String type automatically)
- Chunk the file contents into appropriate amounts (here we'll do it per-row naively, for illustration)
- Bulk embed the embeddings and add them to Qdrant
Here we're using the `async-openai` library to be able to create the embedding - but if you don't want to use OpenAI, you can always use `fastembed-rs` as an alternative or another crate of your choice that allows embedding creation.
```rust
use std::path::PathBuf;
use async_openai::types::{CreateEmbeddingRequest, EmbeddingInput};
use anyhow::Result;
impl RagSystem {
async fn embed_and_upsert_csv_file(&self, file_path: PathBuf) -> Result<()> {
let file_contents = std::fs::read_to_string(&file_path)?;
// note here that we skip 1 because CSV files typically have headers
// if you don't have any headers, you can remove it
let chunked_file_contents: Vec =
file_contents.lines().skip(1).map(|x| x.to_owned()).collect();
let embedding_request = CreateEmbeddingRequest {
model: "text-embedding-ada-002".to_string(),
input: EmbeddingInput::StringArray(chunked_file_contents.to_owned()),
encoding_format: None, // defaults to f32
user: None,
dimensions: Some(1536),
};
let embeddings = Embeddings::new(&self.openai_client)
.create(embedding_request)
.await?;
if embeddings.data.is_empty() {
return Err(anyhow::anyhow!(
"There were no embeddings returned by OpenAI!"
));
}
let embeddings_vec: Vec> =
embeddings.data.into_iter().map(|x| x.embedding).collect();
// note that we create the upsert_embedding function later on
for embedding in embeddings_vec {
self.upsert_embedding(embedding, file_contents.clone())
.await?;
}
Ok(())
}
}
```
We'll then need to embed any further inputs to search for any matching embeddings. The `embed_prompt` function will look quite similar to the embedding part of our `embed_and_upsert_csv_file` function. However, it will instead return a `Vec` as we'll want to use this later to search our collection.
```rust
impl RagSystem {
pub async fn embed_prompt(&self, prompt: &str) -> Result> {
let embedding_request = CreateEmbeddingRequest {
model: "text-embedding-ada-002".to_string(),
input: EmbeddingInput::String(prompt.to_owned()),
encoding_format: None, // defaults to f32
user: None,
dimensions: Some(1536),
};
let embeddings = Embeddings::new(&self.openai_client)
.create(embedding_request)
.await?;
if embeddings.data.is_empty() {
return Err(anyhow::anyhow!(
"There were no embeddings returned by OpenAI!"
));
}
Ok(embeddings.data.into_iter().next().unwrap().embedding)
}
}
```
### Upserting embeddings
Once we've created our embeddings, we'll create a method for adding embeddings into Qdrant called `upsert_embedding`. This will deal with creating the payload for our embedding and insert it into the database. Once added to the collection, we can search our collection later on and get the associated JSON payload alongside the embedding!
The function will look like this:
```rust
use qdrant_client::prelude::PointStruct;
impl RAGSystem {
async fn upsert_embedding(&self, embedding: Vec, file_contents: String) -> Result<()> {
let payload = serde_json::json!({
"document": file_contents
})
.try_into()
.map_err(|x| anyhow::anyhow!("Ran into an error when converting the payload: {x}"))?;
let points = vec![PointStruct::new(
uuid::Uuid::new_v4().to_string(),
embedding,
payload,
)];
self.qdrant_client
.upsert_points(REGULAR_COLLECTION_NAME.to_owned(), None, points, None)
.await?;
Ok(())
}
}
```
Here, we use a `uuid::Uuid` as a unique identifier for our embedding(s). You can also do the same thing by having a `u64` counter that increases with every embedding. However, you'll want to make sure you don't accidentally overwrite your own embeddings! Inserting a new embedding with the same ID as a currently existing embedding in the collection will **overwrite** the embedding.
Of course, we also need to create a method for adding things to our cache. Note that our payload is different here. Instead of using the `document` payload field, we use `answer` since the payload will hold a pre-generated answer to the question.
```rust
impl RagSystem {
pub async fn add_to_cache(&self, embedding: Vec, answer: String) -> Result<()> {
let payload = serde_json::json!({
"answer": answer
})
.try_into()
.map_err(|x| anyhow::anyhow!("Ran into an error when converting the payload: {x}"))?;
let points = vec![PointStruct::new(
uuid::Uuid::new_v4().to_string(),
embedding,
payload,
)];
self.qdrant_client
.upsert_points(CACHE_COLLECTION_NAME.to_owned(), None, points, None)
.await?;
Ok(())
}
}
```
### Searching Qdrant collections
Having made something we can search against in Qdrant, we'll need to implement some methods for our `VectorDB`. We'll split this up into two methods:
- `search_regular_collection`
- `search_cache_collection`
When searching for an embedding, we should attempt to search our semantic cache using `search_cache_collection` - if it doesn't find anything, we should then use the regular `search_regular_collection` method to get the document, prompt OpenAI with it and then return the result as
To make our methods a little bit more error-resistant, we have used `.into_iter().next()` on the results. This tries to find the first item in the vector by only going to the first item in the vector. This works because we're only looking for one single embedding, but you can increase or decrease the limit as you'd like.
Once we find a match, we need to get the `document` key from our JSON payload associated with the embedding match and return it. We'll be using this as context in our RAG prompt later on!
```rust
use qdrant_client::qdrant::{
with_payload_selector::SelectorOptions, SearchPoints, WithPayloadSelector
};
impl RagSystem {
pub async fn search(&self, embedding: Vec) -> Result {
let payload_selector = WithPayloadSelector {
selector_options: Some(SelectorOptions::Enable(true)),
};
let search_points = SearchPoints {
collection_name: REGULAR_COLLECTION_NAME.to_owned(),
vector: embedding,
limit: 1,
with_payload: Some(payload_selector),
score_threshold: Some(0.35f32),
..Default::default()
};
let search_result = self
.qdrant_client
.search_points(&search_points)
.await
.inspect_err(|x| println!("An error occurred while searching for points: {x}"))
.unwrap();
let result = search_result.result.into_iter().next();
let Some(result) = result else {
return Err(anyhow::anyhow!("There's nothing matching."));
};
Ok(result.payload.get("document").unwrap().to_string())
}
}
```
Of course, you'll also want to implement a function for searching your cache collection. Note that although the functions are _mostly_ the same, we get the `answer` field from the payload instead of `document` for semantics.
```rust
impl RagSystem {
pub async fn search_cache(&self, embedding: Vec) -> Result {
let payload_selector = WithPayloadSelector {
selector_options: Some(SelectorOptions::Enable(true)),
};
let search_points = SearchPoints {
collection_name: CACHE_COLLECTION_NAME.to_owned(),
vector: embedding,
limit: 1,
with_payload: Some(payload_selector),
..Default::default()
};
let search_result = self
.qdrant_client
.search_points(&search_points)
.await
.inspect_err(|x| println!("An error occurred while searching for points: {x}"))?;
let result = search_result.result.into_iter().next();
let Some(result) = result else {
return Err(anyhow::anyhow!("There's nothing matching."));
};
Ok(result.payload.get("answer").unwrap().to_string())
}
}
```
### Prompting
Of course, now that everything else is done, the last thing to do is prompting! Here, you can see below that we generate a prompt that basically consists of the prompt we want, as well as the provided context. We then grab the first result from OpenAI and return the message content.
```rust
use async_openai::types::{
ChatCompletionRequestMessage, ChatCompletionRequestSystemMessageArgs,
ChatCompletionRequestUserMessageArgs, CreateChatCompletionRequestArgs
};
impl RagSystem {
pub async fn prompt(&self, prompt: &str, context: &str) -> Result {
let input = format!(
"{prompt}
Provided context:
{context}
"
);
let res = self
.openai_client
.chat()
.create(
CreateChatCompletionRequestArgs::default()
.model("gpt-4o")
.messages(vec![
ChatCompletionRequestMessage::User(
ChatCompletionRequestUserMessageArgs::default()
.content(input)
.build()?,
),
])
.build()?,
)
.await
.map(|res| {
// We extract the first result
match res.choices[0].message.content.clone() {
Some(res) => Ok(res),
None => Err(anyhow::anyhow!("There was no result from OpenAI")),
}
})??;
println!("Retrieved result from prompt: {res}");
Ok(res)
}
}
```
### Using Qdrant in a Rust web service
Let's have a quick look at a real world example. Below is a HTTP endpoint for the Axum framework that takes our `RAGSystem` as application state. It'll embed the prompt and attempt to search the cache. If there's no result, it searches in the regular collection for a match. The resulting document payload is added to an augmented prompt, and the question and answer are added to the cache. Finally, a response is returned from the endpoint.
```rust
use axum::{Json, extract::State, response::IntoResponse, http::StatusCode};
use serde::Deserialize;
#[derive(Deserialize)]
struct Prompt {
prompt: String,
}
async fn prompt(
State(state): State,
Json(prompt): Json,
) -> Result {
let embedding = match state.embed_prompt(&prompt.prompt).await {
Ok(embedding) => embedding,
Err(e) => {
return Err((
StatusCode::INTERNAL_SERVER_ERROR,
format!("An error occurred while embedding the prompt: {e}"),
))
}
};
if let Ok(answer) = state.search_cache(embedding.clone()).await {
return Ok(answer);
}
let search_result = match state.search(embedding.clone()).await {
Ok(res) => res,
Err(e) => {
return Err((
StatusCode::INTERNAL_SERVER_ERROR,
format!("An error occurred while prompting: {e}"),
))
}
};
let llm_response = match state.prompt(&prompt.prompt, &search_result).await {
Ok(prompt_result) => prompt_result,
Err(e) => {
return Err((
StatusCode::INTERNAL_SERVER_ERROR,
format!("Something went wrong while prompting: {e}"),
))
}
};
if let Err(e) = state.add_to_cache(embedding, &llm_response).await {
return Err((
StatusCode::INTERNAL_SERVER_ERROR,
format!("Something went wrong while adding item to the cache: {e}"),
));
};
Ok(llm_response)
}
```
The last thing to do is setting up our main function. Note that we add the `shuttle_qdrant::Qdrant` annotation to our main function, allowing us to provision a Qdrant instance locally with Docker automatically on a local run. In production though, we'll need the `cloud_url` and `api_key` keys filled out.
```rust
#[shuttle_runtime::main]
async fn main(
#[shuttle_qdrant::Qdrant(
cloud_url = "{secrets.QDRANT_URL}",
api_key = "{secrets.QDRANT_API_KEY}"
)]
qdrant: QdrantClient,
#[shuttle_runtime::Secrets] secrets: SecretStore,
) -> shuttle_axum::ShuttleAxum {
secrets.into_iter().for_each(|x| env::set_var(x.0, x.1));
let rag = RAGSystem::new(qdrant);
let setup_required = true;
if setup_required {
rag.create_regular_collection().await?;
rag.create_cache_collection().await?;
rag.embed_csv_file("test.csv".into()).await?;
}
let rtr = Router::new().route("/prompt", post(prompt)).with_state(rag);
Ok(rtr.into())
}
```
## Deploying
To deploy, all you need to do is use `shuttle deploy` (with the `--ad` flag if on a Git branch with uncommitted changes) and wait for it to deploy! Once you've deployed, any further deploys needed will only need to re-compile your application (and any extra dependencies if added) then it'll be done much, much faster.
## Extending this example
Want to extend this example? Here's a couple ways you can do that.
### Use a cheaper model for semantic caching
While using a high-performance model is great and all, one thing that we want to save on in particular is costs. One thing that we can do here to save tokens is by using a cheaper model and asking the model if one question is semantically the same as another. Here's a prompt you can use:
```
Are these two questions semantically the same? Answer either 'Yes' or 'No'. Do not answer with anything else. If you don't know the answer, say 'I don't know'.
Question 1:
Question 2:
```
### Smaller payload indexes
It should be noted of course that while our example _does_ work, one thing you might need to think about is payload indexes or associated data connected to a particular embedding. If you're inserting the whole file contents as the payload for every single embedding in a large file, chances are you are going to increase your resource usage quite rapidly. You can mitigate this by only inserting a relevant slice of the file per embedding (so for example in this case, it might be the row).
## Finishing up
Thanks for reading! By using semantic caching, we can create a much more performant RAG system that saves on both time and costs.
Read more:
- [Building a RAG agent workflow](https://www.shuttle.dev/blog/2024/05/23/building-agentic-rag-rust-qdrant)
- [Parallelize your data processing using Rayon](https://www.shuttle.dev/blog/2024/04/11/using-rayon-rust)
- [Using Huggingface with Rust](https://www.shuttle.dev/blog/2024/05/01/using-huggingface-rust)
---
# Building Agentic RAG with Rust, Qdrant & OpenAI
Source: https://www.shuttle.dev/blog/2024/05/23/building-agentic-rag-rust-qdrant
Date: 23 May 2024
Author: josh
Tags: rust, ai, rag, guide
Using GPT-4o, Qdrant and Rust to build an agentic RAG workflow in a web service and deploy it
Hey there! In this article, we're gonna talk about building an agentic RAG workflow with Rust! We'll be building an agent that can take a CSV file, parse it and embed it into Qdrant, as well as retrieving the relevant embeddings from Qdrant to answer questions from users about the contents of the CSV file.
Interested in deploying or just want to see what the final code looks like? You can find the repository [here.](https://github.com/joshua-mo-143/shuttle-agentic-rag)
## What is Agentic RAG?
Agentic RAG, or Agentic Retrieval Augmented Generation, is the concept of mixing AI agents with RAG to be able to produce a workflow that is even better at being tailored to a specific use case than an agent workflow normally would be.
Essentially, the difference between this workflow and a regular agent workflow would be that each agent can individually access embeddings from a vector database to be able to retrieve contextually relevant data - resulting in more accurate answers across the board in an AI agent workflow!
## Getting Started
To get started, use `shuttle init` to create a new project.
Next, we'll add the dependencies we need using a shell snippet:
```bash
cargo add anyhow
cargo add async-openai
cargo add qdrant-client
cargo add serde -F derive
cargo add serde-json
cargo add shuttle-qdrant
cargo add uuid -F v4
```
We'll also need to make sure to have a Qdrant URL and an API key, as well as an OpenAI API key. Shuttle uses environment variables via a `SecretStore` macro in the main function, and can be stored in the `Secrets.toml` file:
```toml
OPENAI_API_KEY = ""
```
Next, we'll update our main function to have our Qdrant macro and our secrets macro. We'll iterate through each secret and set it as an environment variable - this allows us to use our secrets globally, without having to reference the `SecretStore` variable at all:
```rust
#[shuttle_runtime::main]
async fn main(
#[shuttle_qdrant::Qdrant] qdrant_client: QdrantClient,
#[shuttle_runtime::Secrets] secrets: SecretStore,
) -> shuttle_axum::ShuttleAxum {
secrets.into_iter().for_each(|x| {
set_var(x.0, x.1);
});
let router = Router::new()
.route("/", get(hello_world));
Ok(router.into())
}
```
## Building an agentic RAG workflow
### Setting up our agent
The agent itself is quite simple: it holds an OpenAI client, as well as a Qdrant client to be able to search for relevant document embeddings. Other fields can also be added here, depending on what capabilities your agent requires.
```rust
use async_openai::{config::OpenAIConfig, Client as OpenAIClient};
use qdrant_client::prelude::QdrantClient;
pub struct MyAgent {
openai_client: OpenAIClient,
qdrant_client: QdrantClient,
}
```
Next we'll want to create a helper method for creating the agent, as well as a system message which we'll feed into the model prompt later.
```rust
static SYSTEM_MESSAGE: &str = "
You are a world-class data analyst, specialising in analysing comma-delimited CSV files.
Your job is to analyse some CSV snippets and determine what the results are for the question that the user is asking.
You should aim to be concise. If you don't know something, don't make it up but say 'I don't know.'.
"
impl MyAgent {
pub fn new(qdrant_client: QdrantClient) -> Self {
let api_key = std::env::var("OPENAI_API_KEY").unwrap();
let config = OpenAIConfig::new().with_api_key(api_key);
let openai_client = OpenAIClient::with_config(config);
Self {
openai_client,
qdrant_client,
}
}
}
```
### File parsing and embedding into Qdrant
Next, we will implement a `File` struct for CSV file parsing - it should be able to hold the file path, contents as well as the rows as a `Vec` (string array, or more accurately a vector of strings). There's a few reasons why we store the rows as a `Vec`:
- Smaller chunks improve the retrieval accuracy, one of the biggest challenges that RAG has to deal with. Retrieving a wrong or otherwise inaccurate document can hamper accuracy significantly.
- Improved retrieval accuracy leads to enhanced contextual relevance - which is quite important for complex queries that require specific question.
- Processing and indexing smaller chunks
```rust
pub struct File {
pub path: String,
pub contents: String,
pub rows: Vec,
}
impl File {
pub fn new(path: PathBuf) -> Result {
let contents = std::fs::read_to_string(&path)?;
let path_as_str = format!("{}", path.display());
let rows = contents
.lines()
.map(|x| x.to_owned())
.collect::>();
Ok(Self {
path: path_as_str,
contents,
rows
})
}
}
```
While the above parsing method _is_ serviceable (collecting all the lines into a `Vec`), note that it is a naive implementation. Based on how your CSV files are delimited and/or if there is dirty data to clean up, you may want to either prepare your data so that it is already well-prepared, or include some form of data cleaning or validation. Some examples of this might be:
- `unicode-segmentation` - [a library crate for splitting sentences](https://github.com/unicode-rs/unicode-segmentation)
- `csv_log_cleaner` - [a binary crate for cleaning CSVs](https://github.com/ambidextrous/csv_log_cleaner)
- `validator` - [a library crate for validating struct/enum fields](https://github.com/Keats/validator)
Next, we'll go back to our agent and implement a method for embedding documents into Qdrant that will take the `File` struct we defined.
To do this, we need to do the following:
- Take the rows we created earlier and add them as the input for our embed request.
- Create the embeddings (with openAI) and create a payload for storing alongside the embeddings in Qdrant. Note that although we use a `uuid::Uuid` for unique storage, you could just as easily use numbers by adding a number counter to your struct and incrementing it by 1 after you've inserted an embedding.
- Assuming there are no errors, return `Ok(())`
```rust
use async_openai::types::{ CreateEmbeddingRequest, EmbeddingInput };
use async_openai::Embeddings;
use qdrant_client::prelude::{Payload, PointStruct};
static COLLECTION: &str = "my-collection";
// text-embedding-ada-002 is the model name from OpenAI that deals with embeddings
static EMBED_MODEL: &str = "text-embedding-ada-002";
impl MyAgent {
pub async fn embed_document(&self, file: File) -> Result<()> {
if file.rows.is_empty() {
return Err(anyhow::anyhow!("There's no rows to embed!"));
}
let request = CreateEmbeddingRequest {
model: EMBED_MODEL.to_string(),
input: EmbeddingInput::StringArray(file.rows.clone()),
user: None,
dimensions: Some(1536),
..Default::default()
};
let embeddings_result = Embeddings::new(&self.openai_client).create(request).await?;
for embedding in embeddings_result.data {
let payload: Payload = serde_json::json!({
"id": file.path.clone(),
"content": file.contents,
"rows": file.rows
})
.try_into()
.unwrap();
println!("Embedded: {}", file.path);
let vec = embedding.embedding;
let points = vec![PointStruct::new(
uuid::Uuid::new_v4().to_string(),
vec,
payload,
)];
self.qdrant_client
.upsert_points(COLLECTION, None, points, None)
.await?;
}
Ok(())
}
}
```
### Document searching
Now that we've embedded our document, we'll want a way to check whether our embeddings are contextually relevant to whatever prompt the user gives us. For this, we'll create a `search_document` function that does the following:
- Embed the prompt using `CreateEmbeddingRequest` and get the embedding from the results. We'll be using this embedding in our document search. Because we've only added one sentence to embed here (the prompt), it will only return one sentence - so we can create an iterator from the vector and attempt to find the first result.
- Create a parameter list for our document search through the `SearchPoints` struct (see below). Here we need to set the collection name, the vector that we want to search against (ie the input), how many results we want to be returned if there are any matches, as well as the payload selector.
- Search the database for results - if there are no results, return an an error; if there is a result, then return the result back.
```rust
use qdrant_client::qdrant::{
with_payload_selector::SelectorOptions, SearchPoints, WithPayloadSelector,
};
impl MyAgent {
async fn search_document(&self, prompt: String) -> Result {
let request = CreateEmbeddingRequest {
model: EMBED_MODEL.to_string(),
input: EmbeddingInput::String(prompt),
user: None,
dimensions: Some(1536),
..Default::default()
};
let embeddings_result = Embeddings::new(&self.openai_client).create(request).await?;
let embedding = &embeddings_result.data.first().unwrap().embedding;
let payload_selector = WithPayloadSelector {
selector_options: Some(SelectorOptions::Enable(true)),
};
// set parameters for search
let search_points = SearchPoints {
collection_name: COLLECTION.to_string(),
vector: embedding.to_owned(),
limit: 1,
with_payload: Some(payload_selector),
..Default::default()
};
// if the search is successful
// attempt to iterate through the results vector and find a result
let search_result = self.qdrant_client.search_points(&search_points).await?;
let result = search_result.result.into_iter().next();
match result {
Some(res) => Ok(res.payload.get("contents").unwrap().to_string()),
None => Err(anyhow::anyhow!("There were no results that matched :(")),
}
}
}
```
Now that everything we need to use our agent effectively is set up, we can set up a prompt function!
```rust
use async_openai::types::{
ChatCompletionRequestMessage, ChatCompletionRequestSystemMessageArgs,
ChatCompletionRequestUserMessageArgs, CreateChatCompletionRequestArgs,
};
static PROMPT_MODEL: &str = "gpt-4o";
impl MyAgent {
pub async fn prompt(&self, prompt: &str) -> anyhow::Result {
let context = self.search_document(prompt.to_owned()).await?;
let input = format!(
"{prompt}
Provided context:
{}
",
context // this is the payload from Qdrant
);
let res = self
.openai_client
.chat()
.create(
CreateChatCompletionRequestArgs::default()
.model(PROMPT_MODEL)
.messages(vec![
//First we add the system message to define what the Agent does
ChatCompletionRequestMessage::System(
ChatCompletionRequestSystemMessageArgs::default()
.content(SYSTEM_MESSAGE)
.build()?,
),
//Then we add our prompt
ChatCompletionRequestMessage::User(
ChatCompletionRequestUserMessageArgs::default()
.content(input)
.build()?,
),
])
.build()?,
)
.await
.map(|res| {
//We extract the first one
res.choices[0].message.content.clone().unwrap()
})?;
println!("Retrieved result from prompt: {res}");
Ok(res)
}
}
```
## Hooking the agent up to our web service
Because we separated the agent logic from our web service logic, we just need to connect the bits together and we should be done!
Firstly, we'll create a couple of structs - the `Prompt` struct that will take a JSON prompt, and the `AppState` function that will act as shared application state in our Axum web server.
```rust
#[derive(Deserialize)]
pub struct Prompt {
prompt: String,
}
#[derive(Clone)]
pub struct AppState {
agent: MyAgent,
}
```
We'll also introduce our prompt handler endpoint here:
```rust
async fn prompt(
State(state): State,
Json(json): Json,
) -> Result {
let prompt_response = state.agent.prompt(&json.prompt).await?;
Ok((StatusCode::OK, prompt_response))
}
```
Then we need to parse our CSV file in the main function, create our `AppState` and embed the CSV, as well as setting up our router:
```rust
#[shuttle_runtime::main]
async fn main(
#[shuttle_qdrant::Qdrant] qdrant_client: QdrantClient,
#[shuttle_runtime::Secrets] secrets: SecretStore,
) -> shuttle_axum::ShuttleAxum {
secrets.into_iter().for_each(|x| {
set_var(x.0, x.1);
});
// note that this already assumes you have a file called "test.csv"
// in your project root
let file = File::new("test.csv".into())?;
let state = AppState {
agent: MyAgent::new(qdrant_client),
};
state.agent.embed_document(file).await?;
let router = Router::new()
.route("/", get(hello_world))
.route("/prompt", post(prompt))
.with_state(state);
Ok(router.into())
}
```
## Deploying
To deploy, all you need to do is use `shuttle deploy` (with the `--ad` flag if on a Git branch with uncommitted changes), sit back and watch the magic happen!
## Finishing Up
Thanks for reading! With the power of combining AI agents and RAG, we can create powerful workflows to be able to satisfy many different use cases. With Rust, we can leverage performance benefits to be able to run our workflows safely and with a low memory footprint.
Read more:
- [Using Huggingface with Rust](https://www.shuttle.dev/blog/2024/05/01/using-huggingface-rust)
- [Building a RAG web service with Qdrant & Rust](https://www.shuttle.dev/blog/2024/02/28/rag-llm-rust)
- [Prompting AWS Bedrock with the AWS Rust SDK](https://www.shuttle.dev/blog/2024/05/10/prompting-aws-bedrock-rust)
---
# Building AI Agents with Rust
Source: https://www.shuttle.dev/blog/2024/05/16/building-ai-content-writer-rust-gpt4o
Date: 16 May 2024
Author: josh
Tags: rust, ai, guide
Using GPT-4o and Rust to build AI agents in a web service and deploy them
Hello world! In this guide, we're going to talk about how you can get started with using AI agents to create a content writer that will use the [Serper.dev](http://Serper.dev) API to search Google for results on your query, then use the results together with GPT-4o to create a summary of the results and finally create an article about it.
Interested in just deploying or got stuck during the tutorial? [Have a look at the repository.](https://github.com/joshua-mo-143/shuttle-content-writer)
## Setting up
To get started, we'll create a new project using `cargo-shuttle init`, making sure to pick Axum as the framework. After that, we'll install the dependencies we need:
```bash
cargo add async-openai
cargo add reqwest -F json
cargo add serde -F derive
cargo add serde_json
cargo add thiserror
```
You will also additionally need API keys from Serper and OpenAI, which you will put in a new `Secrets.toml` file in your project root:
```toml
SERPER_API_KEY = ""
OPENAI_API_KEY = ""
```
## Error handling
Before we get started, let's quickly define some error types. We can add this to an `errors.rs` file and use `thiserror`. The reason why we'll do this is for error propagation: instead of manually pattern matching, if we want the error to be propagated we can use this enum as the error return type then use error propagation:
```rust
use async_openai::error::OpenAIError;
use axum::http::StatusCode;
use axum::response::{IntoResponse, Response};
use thiserror::Error;
#[derive(Error, Debug)]
pub enum ApiError {
#[error("OpenAI error: {0}")]
OpenAI(#[from] OpenAIError),
#[error("Reqwest error: {0}")]
Reqwest(#[from] reqwest::Error),
#[error("De/serialization error: {0}")]
SerdeJson(#[from] serde_json::Error),
}
impl IntoResponse for ApiError {
fn into_response(self) -> Response {
let (status, body) = match self {
Self::OpenAI(err) => (StatusCode::INTERNAL_SERVER_ERROR, err.to_string()),
Self::Reqwest(err) => (StatusCode::INTERNAL_SERVER_ERROR, err.to_string()),
Self::SerdeJson(err) => (StatusCode::INTERNAL_SERVER_ERROR, err.to_string()),
};
println!("An error happened: {body}");
(status, body).into_response()
}
}
```
This is enabled by `ApiError` implementing `From`, allowing easy propagation.
## Building AI Agents
Our first step will be defining a generic interface that all of our autonomous agents will work with. We'll be creating two agents:
- A researcher (takes some data from a Google search, feeds it into ChatGPT and asks it to summarize the information)
- A writer (takes the summary and writes an article about it)
It will look something like this:
```rust
use async_openai::{config::OpenAIConfig, Client as OpenAIClient};
pub trait Agent {
fn name(&self) -> String;
fn client(&self) -> OpenAIClient;
fn system_message(&self) -> String;
// to be given a default implementation later
async fn prompt(&self, input: &str, data: String) -> Result;
}
```
Why do we need the other 3 methods if `prompt()` already uses `self`? This is because as part of the `Agent` trait, the prompt function **cannot** reference types that it doesn't know about. If we have a struct that has the `async_openai::Client` type already, we need to create a method from the `Agent` trait to be able to access the client.
If you're only creating one agent, typically you don't need a specific trait. However, if you wanted to create more agents in the same library or application, it would be a good idea to have a generic interface to hold all of the relevant methods!
Let's define our `Researcher` struct, which will hold the data and methods for us to query the Serper API and then use the data to prompt a model:
```rust
#[derive(Clone)]
pub struct Researcher {
http_client: reqwest::Client,
system: Option,
openai_client: OpenAIClient,
}
```
Next, we can implement the `Agent` trait for our struct:
```rust
impl Agent for Researcher {
fn name(&self) -> String {
"Researcher".to_string()
}
fn client(&self) -> OpenAIClient {
self.openai_client.clone()
}
fn system_message(&self) -> String {
if let Some(message) = &self.system {
message.to_owned()
} else {
"You are an agent.
You will receive a question that may be quite short or does not have much context.
Your job is to research the Internet and to return with a high-quality summary to the user, assisted by the provided context.
The provided context will be in JSON format and contains data about the initial Google results for the website or query.
Be concise.
Question:
".to_string()
}
}
}
```
Note that here, the `name()` and `client()` functions are mostly boilerplate. If you wanted to extend this even further, you could use a macro to get rid of this totally.
The system message will be for pre-prompting the model. When we prompt the model, the system message will be passed in and then the bot will respond to the prompt according to the system message. In models where system messages don't exist, this would simply represent the text before you put your prompt.
We also implement two methods for `impl Researcher`: one to initialise the struct itself, and then one for preparing the data to send into our agent pipeline:
```rust
use std::env;
use reqwest::header::HeaderMap;
impl Researcher {
pub fn new() -> Self {
let api_key = env::var("OPENAI_API_KEY").unwrap();
let config = OpenAIConfig::new().with_api_key(api_key);
let openai_client = OpenAIClient::with_config(config);
let mut headers = HeaderMap::new();
headers.insert(
"X-API-KEY",
env::var("SERPER_API_KEY").unwrap().parse().unwrap(),
);
headers.insert("Content-Type", "application/json".parse().unwrap());
let http_client = reqwest::Client::builder()
.default_headers(headers)
.build()
.unwrap();
Self {
http_client,
system: None,
openai_client,
}
}
pub async fn prepare_data(&self, prompt: &str) -> Result {
let json = serde_json::json!({
"q": prompt
});
let res = self
.http_client
.post("")
.json(&json)
.send()
.await
.unwrap();
let json = res.json::().await?;
Ok(serde_json::to_string_pretty(&json)?)
}
}
```
The `Writer` half of our AI agents will mostly be the same, save the `reqwest::Client`. We need to implement `Agent` alongside it, however,
```rust
#[derive(Clone)]
pub struct Writer {
system: Option,
client: OpenAIClient,
}
impl Writer {
pub fn new() -> Self {
let api_key = env::var("OPENAI_API_KEY").unwrap();
let config = OpenAIConfig::new().with_api_key(api_key);
let client = OpenAIClient::with_config(config);
Self {
system: None,
client,
}
}
}
impl Agent for Writer {
fn name(&self) -> String {
"Writer".to_string()
}
fn client(&self) -> OpenAIClient {
self.client.clone()
}
fn system_message(&self) -> String {
if let Some(message) = &self.system {
message.to_owned()
} else {
"You are an agent.
You will receive some context from another agent about some Google results that a user has searched.
Your job is to research the Internet and to write a high-quality article that a user has written. The article must not appear to be AI written. The article should be SEO optimised without overly compromising the
quality of the article.
You are free to be as creative as you wish. However, each paragraph must have the following:
- The point you are trying to make
- If there is a follow up action point
- Why the follow up action point exists (or why the user needs to carry it out)
Search query:
".to_string()
}
}
}
```
Finally, we'll go back and fill the `prompt` method back in on the default `Agent` trait so that we have a default method implementation (and therefore don't need to keep re-implementing it):
```rust
use async_openai::types::{
ChatCompletionRequestMessage, ChatCompletionRequestSystemMessageArgs,
ChatCompletionRequestUserMessageArgs, CreateChatCompletionRequestArgs,
};
async fn prompt(&self, input: &str, data: String) -> Result {
let input = format!(
"{input}
Provided context:
{}
",
serde_json::to_string_pretty(&data)?
);
let res = self
.client()
.chat()
.create(
CreateChatCompletionRequestArgs::default()
.model("gpt-4o")
.messages(vec![
//First we add the system message to define what the Agent does
ChatCompletionRequestMessage::System(
ChatCompletionRequestSystemMessageArgs::default()
.content(&self.system_message())
.build()?,
),
//Then we add our prompt
ChatCompletionRequestMessage::User(
ChatCompletionRequestUserMessageArgs::default()
.content(input)
.build()?,
),
])
.build()?,
)
.await
.map(|res| {
//We extract the first one
res.choices[0].message.content.clone().unwrap()
})?;
println!("Retrieved result from prompt: {res}");
Ok(res)
}
```
### Writing our web service
Now that the hard work is over - we can implement the AI agents in our web application!
To get started, we'll create an `AppState` struct that implements `Clone`. Typically, this is a trait bound set by Axum or pretty much any Rust-based framework that you use. In it we'll have our `Researcher` and `Writer` struct:
```rust
use crate::agent::{Researcher, Writer};
#[derive(Clone)]
pub struct AppState {
pub researcher: Researcher,
pub writer: Writer,
}
impl AppState {
pub fn new() -> Self {
let researcher = Researcher::new();
let writer = Writer::new();
Self { researcher, writer }
}
}
```
Next, we will write our handler endpoint that will take in a JSON input, run the agent pipeline and then return the end result:
```rust
#[derive(Deserialize, Serialize)]
pub struct Prompt {
q: String,
}
#[axum::debug_handler]
async fn prompt(
State(state): State,
Json(prompt): Json,
) -> Result {
let data = state.researcher.prepare_data(&prompt.q).await?;
let resarcher_result = state.researcher.prompt(&prompt.q, data).await?;
let writer_result = state.writer.prompt(&prompt.q, res).await?;
Ok(writer_result)
}
```
And that's basically it!
We can then hook it all up by adding our endpoint to the router:
```rust
let router = Router::new()
.route("/", get(hello_world))
.route("/prompt", post(prompt))
.with_state(state);
```
## Deployment
Now all we need to do is use `shuttle deploy` (adding the `--ad` flag if on an uncommitted Git branch) and watch the magic happen!
## Extending this project
### Making a Pipeline struct for your agents
So let's say you've built this example, and want to go even further. What about pulling in another agent that generates a Twitter post or a LinkedIn post. At this point, you probably want to build a pipeline that holds all your agents, then you can just write `.run_pipeline()` and it'll do everything for you.
To do this, you could create a `Pipeline` trait does two things:
- Initialise the agents set (and return it as a `Vec>`)
- Run the vector as a pipeline, where the results of the previous agent gets fed into the next one
However, you may run into an issue with your Agents needing to implement `Sized`. This is because `Clone` requires an object to be a known size at compile-time - otherwise it won't work! To fix this, we can wrap the `dyn` type in a `Box`, allocating it on the heap. This works because the `Clone` trait requires the type to have a known, static size at compile-time.
Additionally, you might also receive an error with not being able to compile because of the `prompt()` method being async. You can fix this by adding the `async_trait` crate, then using the attribute macro above your code:
```rust
#[async_trait::async_trait]
trait Agent {
// ..
}
```
Note that for every `impl Agent for T`, you'll also need to remember to add the async trait macro. Otherwise, you'll get an error about the lifetime annotations not matching!
### Updating the prompt
If you're not happy with the prompt results, don't forgetyou can always update the message prompt that gets sent to your model!
## Finishing Up
By leveraging Rust with the power of GPT-4o, you can develop a robust AI-powered content writer.
## Additional Resources
For further learning and details, refer to:
- [Building Your First AI Tool in Rust - www.shuttle.dev](https://www.shuttle.dev/blog/2024/04/29/building-your-first-ai-tool-rust)
- [Using Huggingface with Rust - www.shuttle.dev](https://www.shuttle.dev/blog/2023/03/01/getting-started-with-rust-and-gpt)
---
# Prompting AWS Bedrock with Rust
Source: https://www.shuttle.dev/blog/2024/05/10/prompting-aws-bedrock-rust
Date: 10 May 2024
Author: josh
Tags: rust, ai, aws, guide
Prompting AWS Bedrock with Rust, looking at outputting both static and streamed GPT responses
Hey there! In this article we're going to talk about using AWS Bedrock with Rust. At the end of this article, you'll have a API that can take a JSON prompt from a HTTP request and return an answer from AWS Bedrock that can be streamed or returned as a full response.
Interested in the full code? You can find the repository [here.](https://github.com/joshua-mo-143/shuttle-bedrock-ex)
## What is AWS Bedrock?
AWS Bedrock is one of the AI-based services that Amazon offers. It allows you to use models directly for inference and generative AI.
Compared to other AWS offerings like SageMaker, you only pay for each API call. This makes it much cheaper to use in a real application compared to SageMaker, which charges you based on instance uptime and can snowball costs very quickly. Bedrock also comes with tools like guard rails to allow you to customise topic/word filters (to mitigate model abuse) and add your own training data.
## Getting Started
### Setting up your foundational model
Before we get started, you'll need to set up access to the foundational model you want to use and an IAM user. We'll use the Titan Text G1 Express model as an example.
To request access to a model, do the following:
- Log into AWS Console and go to the AWS Bedrock section (it can also be found using the search bar)
- Click "Model Access" on the left hand side - it's somewhere near the bottom.
- Click "Manage Model access" (top right hand side of the table).
- Find the model(s) you want access to, click the appropriate checkbox then click Request Access.
Note that some models require you to elaborate on your use case before AWS will approve access. The Titan Text models will generally grant you immediate access to use them. Once done, you'll need to find (and save) the name of the model ID that you're using!
You can find the endpoint URL you need [here,](https://docs.aws.amazon.com/general/latest/gr/bedrock.html) as well as the model ID [here.](https://docs.aws.amazon.com/bedrock/latest/userguide/model-ids.html#model-ids-arns)
### Setting up an IAM user
You'll also need an access key ID and secret access key from an IAM user:
- `AWS_ACCESS_KEY_ID` (your Access Key)
- `AWS_SECRET_ACCESS_KEY` (your Secret Access Key)
Both can be found in your IAM user credentials if you've already set a user up. If you don't have an appropriate user with policies, you can get started quickly by doing the following:
- Go to the Users menu
- Start creating a user and go to the "Attach policies" section (then search "Bedrock")
- Here you can either use the "AmazonBedrockFullAccess" policy which gives you full access to Bedrock on that user, or you can create a custom policy. Select one and finish creating your user. **Access to Bedrock is required**, as otherwise you won't be able to use it!
- Go back to the Users menu and click on your newly created user
- Go to "Access keys" and follow the prompt (clicking "Application outside of AWS"). Don't forget to store your Access Key ID and Secret Access Key!
In production, you may want to go a step further and create a Group that you can then attach policies and users to.
### Initialisation
To get started, we're going to use `shuttle init` (requires `cargo-shuttle` installed) to initialise our template, picking Axum as the framework.
Next, we're going to add our dependencies:
```bash
cargo add aws-config -F behavior-version-latest
cargo add aws-credential-types -F hardcoded-credentials
cargo add aws-sdk-bedrockruntime -F behavior-version-latest
cargo add serde -F derive
cargo add serde-json
```
You'll also want to store your secrets in a `Secrets.toml` file (in the root of your project) like so:
```rust
AWS_ACCESS_KEY_ID = "your-access-key-id"
AWS_SECRET_ACCESS_KEY = "your-secret-access-key"
AWS_URL = "your-endpoint-url"
```
## Setting up the AWS config
To get started, we'll create a function that will take secrets from our Secrets.toml file that we created earlier.
This can be done by adding the `#[shuttle_runtime::Secrets]` macro to our main function:
```rust
use shuttle_runtime::SecretStore;
#[shuttle_runtime::main]
async fn main(
#[shuttle_runtime::Secrets] secrets: SecretStore
) -> shuttle_axum::ShuttleAxum {
// .. your code here
}
```
On a local or deployment run, the secrets macro will allow the Shuttle runtime to read the `Secrets.toml` file!
Next we'll grab our secrets, then create our AWS `Credentials` struct then create an `aws_config` Config type. This will allow us to create the AWS Bedrock Runtime client, as well as any other client from the AWS Rust SDK that we need.
```rust
use cargo_shuttle::SecretStore;
use aws_credential_types::Credentials;
use aws_sdk_bedrockruntime::Client;
async fn create_client(secrets: SecretStore) -> Client {
let access_key_id = secrets
.get("AWS_ACCESS_KEY_ID")
.expect("AWS_ACCESS_KEY_ID not set in Secrets.toml");
let secret_access_key = secrets
.get("AWS_SECRET_ACCESS_KEY")
.expect("AWS_ACCESS_KEY_ID not set in Secrets.toml");
let aws_url = secrets
.get("AWS_URL")
.expect("AWS_ACCESS_KEY_ID not set in Secrets.toml");
// note here that the "None" is in place of a session token
let creds = Credentials::from_keys(access_key_id, secret_access_key, None);
let cfg = aws_config::from_env()
.endpoint_url(aws_url)
// Note: Don't forget to set this to the appropriate region!
.region(Region::new("us-east-1"))
.credentials_provider(creds)
.load()
.await;
Client::new(&cfg)
}
```
Onto using the runtime itself!
## Using the Bedrock runtime
### Pre-requisites
Before we start using the Bedrock runtime, you'll need:
- a model ID (for a model that you have access to)
- the identifier of the guardrail you want to use (if you're using one)
- the content type (JSON by default)
You can check out the model IDs [here.](https://docs.aws.amazon.com/bedrock/latest/userguide/model-ids.html#model-ids-arns)
### Getting a Prompt Response
For this example, we'll be using the Titan Text G1 Lite model. Although some models may differ in their request bodies and/or response body shape, the process is largely the same.
Before we can write our endpoint, we'll need to define a few structs:
- A JSON input (that contains the prompt)
- A struct that models the HTTP response from Bedrock for our model
- A struct that models the HTTP request to Bedrock for our model
```rust
use serde::{Deserialize, Serialize};
#[derive(Deserialize, Serialize)]
struct Prompt {
prompt: String,
}
#[derive(Deserialize, Debug)]
#[serde(rename_all = "camelCase")]
pub struct TitanResponse {
input_text_token_count: i32,
results: Vec,
}
#[derive(Deserialize, Debug)]
#[serde(rename_all = "camelCase")]
struct TitanTextResult {
token_count: i32,
output_text: String,
completion_reason: String,
}
#[derive(Serialize)]
#[serde(rename_all = "camelCase")]
struct TextGenConfig {
temperature: f32,
top_p: f32,
max_token_count: i32,
stop_sequences: Vec,
}
#[derive(Serialize)]
#[serde(rename_all = "camelCase")]
struct TitanRequest {
input_text: String,
text_generation_config: TextGenConfig,
}
impl TitanRequest {
fn new(prompt: String) -> Self {
Self {
input_text: prompt,
text_generation_config: TextGenConfig {
// higher temperature allows for more LLM creativity
// the minimum value, 0.0, allows for a 100% predictable
// response
temperature: 0.2,
// nucleus sampling probability - aka sampling the smallest
// set of words that exceed the "top_p" threshold for a
// response
top_p: 0.0,
// note here that 1 token is between 1 to 4 words
// we have kept the max token count low here
// to avoid high costs
max_token_count: 100,
stop_sequences: vec!["|".to_string()],
},
}
}
}
```
Now onto making our prompt handler! We'll set up a function like so (note that we use destructuring to get access to the inner variable from our JSON prompt struct):
```rust
use axum::response::IntoResponse;
async fn prompt(
State(state): State,
Json(Prompt { prompt }): Json,
) -> Result {
// .. code below
}
```
Next, we'll need to use our client from shared state to send a request to Bedrock.
```rust
use aws_sdk_bedrockruntime::primitives::Blob;
use axum::http::StatusCode;
let titan_req = TitanRequest::new(prompt);
let Ok(prompt) = serde_json::to_vec(&titan_req) else {
return Err(StatusCode::BAD_REQUEST);
};
let blob = Blob::new(prompt);
let res = state.client
.invoke_model()
.body(blob)
.model_id("amazon.titan-text-lite-v1:0:4k")
.send().await
.unwrap();
```
After this, we need to get the response, convert the response body to a `&[u8]` and deserialize it back into a response body struct.
Because the text results come back as a `Vec`, we'll then use `.first()` to then get the first results and immediately return the text as a HTTP string:
```rust
let res: &[u8] = &res.body.into_inner();
let Ok(response_body) = serde_json::from_slice::(res) else {
return Err(StatusCode::INTERNAL_SERVER_ERROR);
};
let Some(TitanTextResult { output_text, .. }) = response_body.results.first() else {
return Err(StatusCode::INTERNAL_SERVER_ERROR);
};
Ok(output_text.to_owned())
```
### Streamed Prompt Responses
Often, it can be better to get a streamed response from a model. Models can often take a long time to formulate a full answer, so having a streamed response can greatly assist with user retention by not requiring them to wait for Bedrock to fully finish processing the tokens.
As you can see below, adding the method for a response stream does not require much change for requesting something from Bedrock:
```rust
let res = state.client
.invoke_model_with_response_stream()
.body(blob)
.model_id("amazon.titan-text-lite-v1:0:4k")
.send().await
.unwrap();
```
However, for our response we do need to make some changes. To be able to create a stream, we need to declare a variable that is compatible with the `futures::stream::Stream` type. We can use the `stream::unfold` function that takes a variable, then puts the mutable state in a closure and then we can do as we like within our stream. The only requirement for this is that we return the item we want to output, as well as the state itself (so the stream can progress).
This would look something like this:
```rust
use futures::stream;
use aws_sdk_bedrockruntime::types::ResponseStream;
let stream = stream::unfold(res.body, |mut state| async move {
let message = state.recv().await.unwrap();
match message {
Some(ResponseStream::Chunk(chunk)) => {
let Ok(response_body) = serde_json::from_slice::(
&chunk.bytes.unwrap().into_inner()
) else {
println!("Unable to deserialize response body :(");
return None;
};
let Some(TitanTextResult { output_text, .. }) = response_body.results.first() else {
println!("No results :(");
return None;
};
Some((output_text.clone(), state))
}
_ => None,
}
});
Ok(axum_streams::StreamBodyAs::text(stream));
```
## Interacting with your API
To make sure that the previous endpoint works, you can use curl on your service:
```bash
curl http://localhost:8000/prompt \
-H 'Content-Type: application/json' \
-d '{"prompt":"Hello world!"}'
```
Note that the above snippet is for a non-streamed response. If you want to receive a streamed response using curl, you need to add the `--no-buffer` flag:
```bash
curl --no-buffer http://localhost:8000/prompt/streamed \
-H 'Content-Type: application/json' \
-d '{"prompt":"Hello world!"}'
```
The reason why you need to do this is because curl by default stores the response in a buffer. By removing the buffer (via the flag), you can immediately receive the text as it comes.
If you want to serve your response from a HTTP webpage, you need to set up a new `TextDecoder` using JavaScript. This is the whole frontend HTML file that you need:
```html
Shuttle AWS Bedrock Prompt
```
If you want to add this file to your Axum service, you'll want to install `tower-http` with the `fs` flag enabled:
```bash
cargo add tower-http -F fs
```
This will allow you to serve a whole directory (or file) on your web service!
We can do this by adding the HTML file to a subfolder of our project root and then declaring it in `Shuttle.toml`. Generally, we can use a wildcard - if we have a folder called `static` (aptly named to hold all our static assets), we can declare it like so:
```bash
assets = ["static/*"]
```
Then in our router, we would add `tower_http::services::ServeDir` as a `tower` layer for our Axum application:
```rust
use tower_http::services::ServeDir;
let router = Router::new()
.route("/prompt", post(prompt))
.route("/prompt/streamed", post(streamed_prompt))
.nest_service("/", ServeDir::new("static"))
.with_state(appstate);
```
## Wrapping it all up
Now it's time to hook it all up! We'll change our `axum::Router` so that it should only have the prompt routes, as well as including the static assets we talked about earlier (you can remove this if you're not using them).
Your Shuttle main function should look like this:
```rust
#[shuttle_runtime::main]
async fn main(
#[shuttle_runtime::Secrets] secrets: SecretStore
) -> shuttle_axum::ShuttleAxum {
// create AWS client
let client = create_client(secrets).await;
// create application shareable state from AWS client
let appstate = AppState::new(client);
// set up the router
let router = Router::new()
.route("/prompt", post(prompt))
.route("/prompt/streamed", post(streamed_prompt))
.with_state(appstate);
Ok(router.into())
}
```
## Deployment
To deploy, all you need to do is `shuttle deploy` (with the `--allow-dirty` flag if working from a Git branch with uncommitted changes) and watch the magic happen! Once finished, you'll get a message containing information about your deployment as well as where you can reach the deployment URL.
Shuttle will also cache your dependencies, so if you need to re-deploy you won't have to worry about waiting to re-compile!
## Finishing up
Thanks for reading! By integrating Rust with AWS Bedrock, you can harness the power of both technologies to build scalable, reliable, and maintainable systems.
Read more:
- [Building a RAG web service with Qdrant and OpenAI](https://www.shuttle.dev/blog/2024/02/28/rag-llm-rust)
- [Building AI agents](https://www.shuttle.dev/blog/2024/04/30/building-ai-agents-rust)
- [Using Huggingface with Rust](https://www.shuttle.dev/blog/2024/05/01/using-huggingface-rust)
---
# Using Huggingface with Rust
Source: https://www.shuttle.dev/blog/2024/05/01/using-huggingface-rust
Date: 1 May 2024
Author: josh
Tags: rust, ai, guide
Using Huggingface with Rust
Hello world! Today, we're going to talk about Huggingface with Rust. We're going to cover the following:
- Downloading a repo from Huggingface
- Tokenizing input and outputting tokens using Huggingface via Candle
- Generating text from tokens
- Using Candle in a web service
By the end of this article, we'll have a fully working web server for running our model on. Interested in the final code? Check it out [here.](https://www.github.com/joshua-mo-143/shuttle-candle)
## What is Huggingface?
Huggingface describes itself simply as:
> The AI community, building the future.
Huggingface is both a company, as well as a platform that contributes heavily to the AI and NLP fields through open source and open science. A couple of examples of how they do this:
- Offering a free platform for free to upload AI models, try other peoples' AI models and gain a lot of insight generally about how LLMs work
- They have an in-depth NLP course teaching you how to create and use transformers, datasets and tokenizers (although it's using Python)
- Giving back to the community by creating frameworks like Candle (Rust)
Huggingface is a huge driving force within the AI community. As you can see, their platform is a great way to be able to start using AI at home, without paying for anything (initially).
## Using Huggingface
### Getting started
To use Huggingface with your Rust application requires the `hf_hub` crate to be added to your Cargo.toml:
```bash
cargo add hf_hub
```
You'll also want the following dependencies which you can grab from this shell snippet:
```bash
cargo add anyhow candle-core candle-nn candle-transformers serde serde_json tokenizers -F serde/derive
```
Before we start initialising the model, let's talk about models. Models typically have a weights map, which determine the strength of connections within your neural network. For example if we were to go to [a HuggingFace repo](https://huggingface.co/mistralai/Mistral-7B-v0.1) (assuming we're logged in and have been granted access), you might see a bunch of files regarding tensors (see below), a JSON file containing model weights as well as some other stuff.
But first before we continue, let's have a quick look at what tensors actually are - as they're quite important to know about!
From Wikipedia:
> a **tensor** is an algebraic object that describes a multilinear relationship between sets of algebraic objects related to a vector space.
Practically speaking for us, this just means multidimensional arrays of numbers (an array with multiple indexes, if you will). We can manipulate tensors and shape them to get output. A real-world example of using a tensor might be a picture. A picture can have height, width and color - which we can model as a 3D tensor. If we feed this into a model by turning it into a data representation, the model can find similar photos by comparing values from its training data and output a relevant response.
To deserialize the weight map file, we'll want to implement a custom deserialization function as the file can contain an unknown amount of keys and values. meaning that we should deserialize it to a `serde_json::Value` first. If you try to just deserialize it directly, will simply tell you that it got a sequence but expected a map (or something similar).
```rust
#[derive(Debug, Deserialize)]
struct Weightmaps {
#[serde(deserialize_with = "deserialize_weight_map")]
weight_map: HashSet,
}
// Custom deserializer for the weight_map to directly extract values into a HashSet
fn deserialize_weight_map<'de, D>(deserializer: D) -> Result, D::Error>
where
D: Deserializer<'de>,
{
let map = serde_json::Value::deserialize(deserializer)?;
match map {
serde_json::Value::Object(obj) => Ok(obj
.values()
.filter_map(|v| v.as_str().map(ToString::to_string))
.collect::>()),
_ => Err(serde::de::Error::custom(
"Expected an object for weight_map",
)),
}
}
```
Next, we'll write a function to load tensors from a file in the "safetensors" format into our program. Safetensors is a data serialization format for storing tensors safely. Created by Hugging Face, it was made to replace the pickle format. In Python, you may have a PyTorch weight model that gets saved (or "pickled") into a `.bin` file with the Python pickle utility. However, this is unsafe and said files may hold malicious code to be executed on un-pickling. Note that `repo.get()` returns `Result`:
```rust
pub fn hub_load_safetensors(
repo: &hf_hub::api::sync::ApiRepo,
json_file: &str,
) -> Result> {
let json_file = repo.get(json_file).map_err(candle_core::Error::wrap)?;
let json_file = std::fs::File::open(json_file)?;
let json: Weightmaps = serde_json::from_reader(&json_file).map_err(candle_core::Error::wrap)?;
let pathbufs: Vec = json
.weight_map
.iter()
.map(|f| repo.get(f).unwrap())
.collect();
Ok(pathbufs)
}
```
Next, we'll add some code to our program for downloading a `mistral-7b` model with the current latest revision at the time of writing. Note that the repository download is quite large, clocking in at around 13.4gb! If you're running this locally, you will want some space to store the model on. You can find the latest version of a repository by going to the repo, clicking on Files and Versions and then going to the commit history. The Mistral-7B-v0.1 repo can be found [here](https://huggingface.co/mistralai/Mistral-7B-v0.1).
To make this easier to follow, we'll first write a function that initialises the `ApiRepo` for us to download files from. We can do this like so, by creating an `ApiBuilder` that takes our token.
```rust
fn get_repo(token: String) -> Result {
let api = ApiBuilder::new().with_token(Some(token)).build()?;
let model_id = "mistralai/Mistral-7B-v0.1".to_string();
api.repo(Repo::with_revision(
model_id,
RepoType::Model,
"26bca36bde8333b5d7f72e9ed20ccda6a618af24".to_string(),
))
}
```
Next, we'll need to set up our tokenizer. This function will use `repo.get()` to download the tokenizer file (returning a path) and then we use `Tokenizer::from_file` to create it:
```rust
fn get_tokenizer(repo: &ApiRepo) -> Result {
let tokenizer_filename = repo.get("tokenizer.json")?;
Ok(Tokenizer::from_file(tokenizer_filename).map_err(E::msg)?)
}
```
Finally, we'll create the model itself:
```rust
fn initialise_model(token: String) -> Result {
let repo = get_repo(token)?;
let tokenizer = get_tokenizer(&repo)?;
let device = Device::Cpu;
let filenames = hub_load_safetensors(&repo, "model.safetensors.index.json")?;
// note that here, we'd set this to true if we were using Flash Attention
// Flash Attention requires the CUDA feature flag to be enabled, but speeds
// up inference
let config = Config::config_7b_v0_1(false);
let model = {
let dtype = DType::F32;
let vb = unsafe { VarBuilder::from_mmaped_safetensors(&filenames, dtype, &device)? };
Mistral::new(&config, vb)?
};
Ok((model, device, tokenizer).into())
}
```
### Creating a Token Output Stream
So we've downloaded our model, loaded the weight map files, loaded them all in and created our model. But how do we use it?
Internally, when you feed an input to a model, it encodes the input into tokens. Tokens can represent words, characters, data - anything. The main idea is that by converting the data to tokens, it allows a model to parse the data more easily. Most of the more popular pretrained models will often have billions, if not trillions of tokens in training data that allow it to produce sophisticated answers. The training data gives words meaning and allows the model to produce an answer according to the input by comparing the input to its training data.
To get started, we will create a stream for encoding our tokens and outputting a stream of tokens:
```rust
pub struct TokenOutputStream {
tokenizer: tokenizers::Tokenizer,
tokens: Vec,
prev_index: usize,
current_index: usize,
}
impl TokenOutputStream {
pub fn new(tokenizer: tokenizers::Tokenizer) -> Self {
Self {
tokenizer,
tokens: Vec::new(),
prev_index: 0,
current_index: 0,
}
}
}
```
Next, we'll implement some methods to do the following:
- Decode tokens into UTF-8 strings
- Advance the internal index and return a string if there is any text
```rust
impl TokenOutputStream {
fn decode(&self, tokens: &[u32]) -> String {
match self.tokenizer.decode(tokens, true) {
Ok(str) => Ok(str),
Err(err) => candle_core::bail!("cannot decode: {err}"),
}
}
pub fn next_token(&mut self, token: u32) -> Result> {
// if there's nothing there, return an empty string
let prev_text = if self.tokens.is_empty() {
String::new()
} else {
// otherwise, use the previous decode method to decode tokens to a String
let tokens = &self.tokens[self.prev_index..self.current_index];
self.decode(tokens)?
};
// add this token to the current list of tokens already processed
self.tokens.push(token);
let text = self.decode(&self.tokens[self.prev_index..])?;
if text.len() > prev_text.len() && text.chars().last().unwrap().is_alphanumeric() {
let text = text.split_at(prev_text.len());
self.prev_index = self.current_index;
self.current_index = self.tokens.len();
Ok(Some(text.1.to_string()))
} else {
Ok(None)
}
}
}
```
We'll also need some auxiliary methods on this struct which we'll call later on when generating our response text. Some comments have been added below to show what these are used for:
```rust
impl TokenOutputStream {
// resets self-state so as not to del
fn clear(&mut self) {
self.tokens.clear();
self.prev_index = 0;
self.current_index = 0;
}
// get access to inner tokenizer as a reference
pub fn tokenizer(&self) -> &tokenizers::Tokenizer {
&self.tokenizer
}
// uses get_vocab() to get a hashmap of tokens to indexes
// then grabs the index value with .get()
pub fn get_token(&self, token_s: &str) -> Option {
self.tokenizer.get_vocab(true).get(token_s).copied()
}
}
```
### Generating text from tokens
As the final piece of the puzzle, we'll create a struct for generating text from our tokens. This is arguably the most important part. There is some terminology here that you may want to be acquainted here before we continue, as otherwise you may be confused:
- `temp` (or temperature) - lets the model know how accurate we want it to be. The lower the temperature, the less likely the model will hallucinate.
- `top_k` - This argument allows the model to only sample from the "top K tokens", then samples based on probability. A lower K value makes the model more predictable and consistent.
- `top_p` - This allows the model to choose from a subset of tokens whose combined probability reaches or exceeds a threshold `p`. This allows you to create diverse responses while still having relevant context.
- `repeat_penalty` - We can decide how much we want to punish repetitive or redundant output here.
- `repeat_last_n` - This allows us to choose the size of the context window that we want for our repeat penalty. Note that a token can be anywhere between 1 to 4 words, so don't make your context window size too large!
To start with generating tokens from text, we can declare our text generator below, like so.
```rust
struct TextGeneration {
model: Mistral,
device: Device,
tokenizer: TokenOutputStream,
logits_processor: LogitsProcessor,
repeat_penalty: f32,
repeat_last_n: usize,
}
impl TextGeneration {
#[allow(clippy::too_many_arguments)]
fn new(
model: Mistral,
tokenizer: Tokenizer,
seed: u64,
temp: Option,
top_p: Option,
_top_k: Option,
repeat_penalty: f32,
repeat_last_n: usize,
device: &Device,
) -> Self {
let logits_processor = LogitsProcessor::new(seed, temp, top_p);
Self {
model,
tokenizer: TokenOutputStream::new(tokenizer),
logits_processor,
repeat_penalty,
repeat_last_n,
device: device.clone(),
}
}
}
```
Next, we need to write a `run` function to actually run our simple pipeline. This will do the following:
- Turn a prompt into encoded tokens
- Ensures that the `` token exists (a sort of "end of tokens" marker)
- Loops over the sample length, creates a tensor, applies a repeat penalty and attempts to get the next token
To start with, let's set up our function - we'll start by clearing the tokenizer of any leftover tokens from previous prompts, then take the prompt and encode it. We then turn the tokens into a vector so that we can process it later on:
```rust
impl TextGeneration {
fn run(mut self, prompt: String, sample_len: usize) -> Result> {
// clear the tokenizer of any previous input here
self.tokenizer.clear();
let mut tokens = self.tokenizer
.tokenizer()
.encode(prompt, true)
.unwrap()
.get_ids()
.to_vec();
println!("Got tokens!");
// .. more code here!
}
}
```
Next, we need to check whether or not the tokenizer has a `` token - this signals the end of the output. If this isn't present, the model might try to run infinitely! Definitely not good. Let's add it in:
```rust
let eos_token = match self.tokenizer.get_token("") {
Some(token) => token,
None => panic!("cannot find the token"),
};
```
The next step is to go enumerate through from a range of 0 to `sample_len`, get the correct token from the start position of where we want to process the tokens from. We then create a new `Tensor` and unsqueeze it. This adds an additional dimension to the tensor and allows tensor multiplication.
```rust
let mut string = String::new();
for index in 0..sample_len {
let context_size = if index > 0 { 1 } else { tokens.len() };
let start_pos = tokens.len().saturating_sub(context_size);
let ctxt = &tokens[start_pos..];
let input = Tensor::new(ctxt, &self.device).unwrap().unsqueeze(0).unwrap();
// more code to come here
}
```
We then perform a forward pass to get the value of the output layer from the input data. In a neural network, this would mean traversing through all of the nodes from first to last and doing a calculation based on the output. This allows us to then compute the `logits` (outputs of a neural network pre-activation function).
```rust
let logits = self.model.forward(&input, start_pos).unwrap();
```
Next, we squeeze the logits. This decreases the number of dimensions in a tensor and allows us to grab the value we want. However, if the repeat penalty is over `1.0`, we need to make sure to apply it! (Note here that we haven't accounted for repeat penalty values under `1.0`).
```rust
let logits = logits.squeeze(0).unwrap().squeeze(0).unwrap().to_dtype(DType::F32).unwrap();
let logits = if self.repeat_penalty == 1.0 {
logits
} else {
let start_at = tokens.len().saturating_sub(self.repeat_last_n);
candle_transformers::utils
::apply_repeat_penalty(&logits, self.repeat_penalty, &tokens[start_at..])
.unwrap()
};
```
We then get our next token by sampling the logits, pushing it to our tokens list and checking if it's the end-of-input token: if it is, break the loop immediately. If not, we add our converted String to the final output! Then we return the output.
```rust
fn run(mut self, prompt: String, sample_len: usize) -> Result> {
// .. previous code here
for index in 0..sample_len {
let next_token = self.logits_processor.sample(&logits).unwrap();
tokens.push(next_token);
if next_token == eos_token {
break;
}
if let Some(t) = self.tokenizer.next_token(next_token).unwrap() {
println!("Found a token!");
string.push_str(&t);
}
}
string
}
```
This is quite a long function - if you get stuck, you can find the final code here:
```rust
impl TextGeneration {
fn run(mut self, prompt: String, sample_len: usize) -> Result> {
self.tokenizer.clear();
let mut tokens = self
.tokenizer
.tokenizer()
.encode(prompt, true)
.unwrap()
.get_ids()
.to_vec();
println!("Got tokens!");
let eos_token = match self.tokenizer.get_token("") {
Some(token) => token,
None => panic!("cannot find the token"),
};
let mut string = String::new();
for index in 0..sample_len {
let context_size = if index > 0 { 1 } else { tokens.len() };
let start_pos = tokens.len().saturating_sub(context_size);
let ctxt = &tokens[start_pos..];
let input = Tensor::new(ctxt, &self.device).unwrap().unsqueeze(0).unwrap();
let logits = self.model.forward(&input, start_pos).unwrap();
let logits = logits.squeeze(0).unwrap().squeeze(0).unwrap().to_dtype(DType::F32).unwrap();
let logits = if self.repeat_penalty == 1. {
logits
} else {
let start_at = tokens.len().saturating_sub(self.repeat_last_n);
candle_transformers::utils::apply_repeat_penalty(
&logits,
self.repeat_penalty,
&tokens[start_at..],
).unwrap()
};
let next_token = self.logits_processor.sample(&logits).unwrap();
tokens.push(next_token);
if next_token == eos_token {
break;
}
if let Some(t) = self.tokenizer.next_token(next_token).unwrap() {
println!("Found a token!");
string.push_str(&t);
}
};
Ok(string)
}
}
```
## Using Candle with a web service
Using the previous functions we've made, we can create a web service using `axum` and `tokio` with an endpoint to run our prompt! No local work required.
To install Axum and Tokio you can use this shell snippet:
```bash
cargo add axum tokio -F tokio/macros,tokio/rt-multi-thread
```
To get started, we'll create an `AppState` that implements `Clone` and some helper methods to shorten down code in application-related functions:
```rust
#[derive(Clone)]
pub struct AppState {
model: Mistral,
device: Device,
tokenizer: Tokenizer
}
impl From<(Mistral, Device, Tokenizer)> for AppState {
fn from(e: (Mistral, Device, Tokenizer)) -> Self {
Self { model: e.0, device: e.1, tokenizer: e.2 }
}
}
impl From for TextGeneration {
fn from(e: AppState) -> Self {
Self::new(
e.model,
e.tokenizer,
299792458, // seed RNG
Some(0.), // temperature
None, // top_p - Nucleus sampling probability stuff
None, // Only sample along the top K samples
1.1, // repeat penalty
64, // context size to consider for the repeat penalty
&e.device,
)
}
}
```
Next, we'll create a `Prompt` struct that can be deserialized from JSON, then an Axum function endpoint:
```rust
#[derive(Deserialize)]
pub struct Prompt {
prompt: String
}
async fn run_pipeline(
State(state): State,
Json(Prompt{prompt}): Json
) -> impl IntoResponse {
let textgen = TextGeneration::from(state);
textgen.run(prompt, 5).unwrap()
}
```
Then we add the endpoint to our main function and it's done:
```rust
#[tokio::main]
async fn main() -> Result<()> {
let Ok(api_token) = std::env::var("HF_TOKEN") else {
return Err(anyhow::anyhow!("Error getting HF_TOKEN env var"))
};
let state = initialise_model(api_token)?;
let router = Router::new()
.route("/", get(hello_world))
.route("/prompt", post(run_pipeline))
.with_state(state);
let tcp_listener = tokio::net::TcpListener::bind("127.0.0.1:8000").await.unwrap();
axum::serve(tcp_listener, router).await.unwrap();
Ok(())
}
```
### Performance considerations
Of course, when you try to run this locally you may notice that CPU performance is somewhat sub-optimal compared to using a high-performance GPU. Generally speaking, while optimal performance can be attained on a GPU, there are times where this is infeasible.
GPU usage is gated by the use of the "CUDA" - Compute Unified Device Architecture - toolkit (and is a feature flag of `candle_core`). However, this would be difficult to use on the web unless you can have CUDA preinstalled. Nevertheless, it unlocks performance enhancing features outside of just your GPU. For example, Flash Attention, a technique that improves inference speeds with better parallelism and work partitioning. You can find the Arvix paper [here.](https://tridao.me/publications/flash2/flash2.pdf)
This is even more noticeable when you're running in debug mode. To alleviate this, you can run in release mode using `shuttle run --release` (or without Shuttle: `cargo run --release`). This will run the release profile of your application, which is much more optimised.
## Finishing up
Thanks for reading! Huggingface makes it much easier to deploy your own and other peoples' models for absolutely free (disregarding electricity usage). Taking advantage of AI is becoming easier than ever!
---
# AI Agents: Building AI Primitives with Rust
Source: https://www.shuttle.dev/blog/2024/04/30/building-ai-agents-rust
Date: 30 April 2024
Author: ian
Tags: rust, ai, guide
Building AI agents with OpenAI and Rust
Remember The Matrix? Yes, that Matrix, the one with leather trenchcoats, bullet-time and simulated steaks.
It was something special at the time - and it also had one of the coolest representations of a computer virus: the infamous Agent Smith, the self-replicating virus embodying the consciousness of a single agent, duplicating itself over and over again, chasing our heroes across the simulation. His superpower lied in his ability to create new instances of himself at any moment, creating and dispatching them to do whatever task needed to be done.
And in this new era of Generative AI, there is one pattern that has consistently proved itself as a core primitive of the LLM world - the Agent. If you haven't heard of the Agent pattern yet, you can think of it just like you'd think of Agent Smith - it's an embodied instance of your LLM - specialising in whatever task you need it to perform, be it writing code, translating inputs, invoking functions or writing haikus about Rust. The Agent pattern allows us to perform more accurate LLM calls, parallelise work and even more important - orchestrate agents by letting one "main" agent dispatch work to others.
So let's take a dive and look at how we can harness the power of LLMs and build agents of our own using Rust.
## Why build them in Rust?
You mean except the speed, efficiency, portability?
Because when developing with agents - especially letting them run functions and code on our machines - we want to make sure we're running it as safe as possible. The memory safety provided by Rust can work as a nice isolation to common attacks, leaving our services safe from any potential exploits via code injection (And of course, if the AI breaks out of the box, having it sandboxed inside a Rust program might just prevent the AI-pocalypse from happening).
But besides safety, the error handling and pattern matching abilities Rust provides can ensure that our code works correctly, which when working with AI agents is quite important. As LLMs can often hallucinate and make mistakes, catching them on time and handling them in a proper manner is extremely important for any production usecase - _you don't want your users to get wrong data, or even worse - someone else's data_. For such things, Rust's powerful error handling really comes handy, allowing us to build safety latches into our product easily.
All of this, when combined with the powerful trait & macro abilities, allows us to create and combine our abstractions safely and enabling us to scale our agents into complex networks with ease. When building real-life usecases that depend on multiple agents working together in sync, you'll find that the number of agents can grow quite fast, especially when adding different evaulation or format translation agents, making it of paramount importance to choose a language that enables you to easily build strong abstractions.
## Agents 101
While Agents might sound like some super complex thing, especially with multiple frameworks and libraries offering similar abstractions, building them is quite simple - they usually consist of a few things:
- The System message - system message is in a way the "core" of your agent, defining its purpose and behaviour. It primes your LLM with instructions on how to behave and answer to your messages.
- The model definition - usually agents also contain reference to the model used, allowing us to switch between more powerful models for accuracy or smaller and faster models for efficiency.
- The supported functions - especially useful if you want to allow your agents to invoke functions from your code, using tools like OpenAPI's function calling to invoke different functions depending on the data provided.
So let's create some agents of our own. Start up your favorite editor, create a Rust project and let's go and define a simple `Agent` struct that will take care of these things for us:
```rust
pub(crate) struct Agent {
pub(crate) system: String,
pub(crate) model: String,
}
```
Now, we also need a way to actually use our agents, so let's add some extras to the struct.
First off, we need to be able to prompt the agent and give it a task to perform. For this, we'll create a `prompt` method that simply takes in a string and returns a string. So let's create our prompt function:
```rust
impl Agent {
async fn prompt(&mut self, input: String) -> Result
}
```
Usually, to make these agents even more useful, we'd also want them to be able to remember their conversation history, allowing us to build some kind of context through the conversation. So let's also add a `history` field that will contain the list of messages. Messages can be created either by the agent itself or by the user, so we'll create an enum to differentiate between them - we'll also add an enum for the `System` message, since that is the first message all agents will receive.
To make them future-proof, we'll also expose the `history` to the outside world, so we can imbue our agents with predetermined messages or fork new agents from existing ones.
While for our example usecase this won't be relevant, in larger and more complex usecases you will probably encounter the need to use message history to remember the context of the previous executions. So let's add those bits of code too:
```rust
pub(crate) enum Role {
AGENT,
USER,
SYSTEM
}
pub(crate) struct Message {
pub(crate) content: String,
pub(crate) role: Role
}
pub(crate) struct Agent {
pub(crate) system: String,
pub(crate) model: String,
pub(crate) history: Vec
}
```
And that is it - the basic building blocks for our agents are in place. Now, how to actually use them?
## Defining the agent's purpose
To actually use our agents, we need to give them a purpose, otherwise they will only be acting like generic LLM models - okay, but not great. By giving them a proper purpose through the system message, we prime them to act a certain way, giving us increased accuracy on tasks.
So for this article, we'll make two simple agents that can be used both together or independently:
- First, we'll create one Agent that will receive a YouTube video and summarise the main talking points for us.
- Then, we'll create another agent that will take that summary and actually make it usable, by translating it to JSON we'll consume inside our code.
Now, you might be wondering why use two separate agents when this could be rolled into one?
Well, while LLM's are quite capable, they're also quite fickle machines - their outputs are quite non-deterministic, so every time we provide the same input, we might get a different output. By trying to squeeze both tasks into a single agent, we increase the chance of having erroneous, inaccurate and unwanted results. For example, if we can achieve 80% accuracy on one task, then accuracy for two tasks could fall to 64% (80% x 80%) - but since these are LLM's, the accuracy can fall even more due to the first task priming the LLM into a specific local minima, i.e. it being more focused on the first task. That is why when developing with LLM agents, the best philosophy to follow is the UNIX philosophy:
> Write programs that do one thing and do it well. Write programs to work together. Write programs to handle text streams, because that is a universal interface.
Incredibly, this nearly 50-year old philosophy serves us well even today and fits perfectly with the LLM world.
So let's create our two agents by following it. First, we'll create our Summarising agent.
To do that, we need to implement our Agent trait. For this, we'll be using the most popular of the LLM providers - OpenAI - and we'll access it using the `async-openai` crate, giving us some simple abstractions over it. So pop open your terminal and add the dependency:
`cargo add async-openai`
To be able to use the `async-openai` crate, we also need an API key from OpenAI - you can find it [here](https://platform.openai.com/api-keys). To use it, just add it to your environment variables or open your terminal and hit:
`export OPENAI_API_KEY='your-key-here'`
Now, let's create an implementation of the prompt method - it's quite simple, we'll just add the OpenAI `Client` to our agent and map the prompt method to the `async_openai`'s prompt:
```rust
pub(crate) struct Agent {
pub(crate) system: String,
pub(crate) model: String,
pub(crate) history: Vec,
pub(crate) client: Client
}
impl Agent {
pub(crate) async fn prompt(&mut self, input: String) -> Result {
//If you are remembering the message history, you can restore it from here.
self.client.chat().create(
CreateChatCompletionRequestArgs::default()
.model(self.model.clone())
.messages(vec![
//First we add the system message to define what the Agent does
ChatCompletionRequestMessage::System(
ChatCompletionRequestSystemMessageArgs::default()
.content(&self.system)
.build()
.unwrap(),
),
//Then we add our prompt
ChatCompletionRequestMessage::User(
ChatCompletionRequestUserMessageArgs::default()
.content(input)
.build()
.unwrap(),
),
])
.build()
.unwrap(),
).await.map(|res| {
//We extract the first one
res.choices[0].message.content.clone().unwrap()
})
//Now here, you can save the prompt and agent response to the history if needed
}
}
```
With that out of the way, we can create the actual first instance of our agent by defining its system prompt and passing it in. So let's write down some instructions that will go in the system prompt.
```rust
static SUMMARY_PROMPT : &str = r#"You are an agent dedicated to summarising video transcripts.
You will receive a transcript and answer with main talking points of the video first,
followed by a complete summary of the transcript. Answer only in this format:
Talking points:
1. ..
2. ..
N. ..
Summary:
Summary of the transcript
"#
```
But first - we need the transcript. To fetch the transcript itself, we'll be using the `youtube-captions` crate. While getting the transcript can be quite straightforward using the API, we'll do it the lazy way and let the crate do the job for us. To do the HTTP request, we'll also need the famous `reqwest` crate, together with `serde` and `serde-json` to deserialize the JSON into a struct. So head on to your Cargo.toml or terminal and add the crates:
```toml
serde = { version = "1.0", features = ["derive"] }
serde_json = "1.0"
youtube-captions = "0.1.0"
reqwest = "0.11"
```
To keep it nice and tidy, let's create a `get_transcript(video: &str) -> String` method. First, we'll use the `youtube-captions` scraper to get the captions:
```rust
async fn get_transcript(video: &str) -> String {
let digest = DigestScraper::new(reqwest::Client::new());
// Fetch the video
let scraped = digest.fetch(video, "en").await.unwrap();
// Find our preferred language - in this case, english
let language = LanguageTag::parse("en").unwrap();
let captions = scraped.captions.into_iter()
.find(|caption| language.matches(&caption.lang_tag))
.unwrap();
let transcript_json = captions.fetch(Format::JSON3).await.unwrap();
}
```
Since youtube doesn't return us the pure caption text but JSON, we'll need to deserialize the captions. To do that we need some structs matching the format - one for the whole transcript, one for the video `events` and one for the captioned `segment` itself, which will contain the captioned UTF-8. So let's make some and mark them with serde's `Deserialize` macro:
```rust
#[derive(Deserialize)]
struct Transcript {
events: Vec,
}
#[derive(Deserialize)]
struct Event {
segs: Option>,
}
#[derive(Deserialize)]
struct Segment {
utf8: String,
}
```
With this, we can deserialize the received object and extract all the captions, joining them together into one giant string.
So open up the `get_transcript` method and let's flatten them all together:
```rust
async fn get_transcript(video: &str) -> String {
// ...
// after fetching the transcript
let root: Transcript = serde_json::from_str(transcript_json.as_str()).unwrap();
// Collect all utf8 fields from all events and all segments
let transcript: String = root.events.iter()
.filter_map(|event| event.segs.as_ref())
.flatten()
.map(|segment| segment.utf8.clone()) // Extract the utf8 field of each segment
.collect::>()
.join(" ");
return transcript
}
```
Now, we're ready to build our agents and put them to work!
Let's create a `summarize_video` function that will wrap it all up - take in the video ID and return us a nice summary of the text. First, we'll use the `get_transcript` method to get the video's transcript, then we'll pass it on to our agent to summarise it for us.
```rust
async fn summarize_video(video: &str) -> String {
let client = Client::with_config(
OpenAIConfig::default(),
);
//First, we fetch the transcript for the video
let transcript = get_transcript(video).await;
// Then we create our summary agent and have it summarize the video for us
let mut summarize_agent = Agent {
system: SUMMARY_PROMPT.to_string(),
model: "gpt-4".to_string(),
history: vec![],
client: client.clone(),
};
let summary = summarize_agent.prompt(transcript).await.unwrap();
}
```
Next, we'll create another agent - one that will take the summary and translate it into the JSON format of our choice. So let's write a new system message for our Agent. To make sure it follows a specific format, it's best to include the format example and some basic rules:
```rust
static SUMMARY_TO_JSON_PROMPT = r#"You are an agent dedicated to translating text to JSON. You will receive the text and return it in JSON format.
The format is as follows:
{
"summary": "Whole video summary goes here",
"talking_points": [
{
"title" : "Title of the point",
"description: "Talking point summary"
},
...
]
}
Rules:
- Follow the specified JSON format closely
- Wrap the JSON in a code block
- Skip prose, return only the JSON
"#
```
And now we can wrap it all together:
```rust
//In summarize_video
...
let mut summary_to_json_agent = Agent {
system: SUMMARY_TO_JSON_PROMPT.to_string(),
client: client.clone(),
model: "gpt-4".to_string(),
history: vec![],
};
let json = summary_to_json_agent.prompt(summary).await.unwrap();
return json;
```
But hold on, we're not done yet - here's the thing - since LLM's can be fickle, we cannot be certain that the output will contain only the JSON, so we'll add an extra utility method that will extract the codeblock from the response.
````rust
fn extract_codeblock(text: &str) -> String {
if !text.contains("```") {
return text.to_string();
}
let mut in_codeblock = false;
let mut extracted_lines = vec![];
for line in text.lines() {
if line.trim().starts_with("```") {
in_codeblock = !in_codeblock;
continue;
}
if in_codeblock {
extracted_lines.push(line);
}
}
extracted_lines.join("\n")
}
````
We can use this on the received response and extract the codeblock if it exists - otherwise, it will return the whole text.
```rust
//...
let json = summary_to_json_agent.prompt(summary).await.unwrap();
let result = extract_codeblock(&json);
return result
```
## Bringing the agents live
Finally, we're ready to use our agents. But uhhh wait, how do we actually use them? If we plan to use them from a frontend, we'll need to create an API around that. Luckily, we can use [Shuttle and Axum together](https://docs.shuttle.dev/examples/axum) to get an API up and running quickly.
First, you need to [install Shuttle](https://docs.shuttle.dev/getting-started/installation) - just hit `cargo binstall cargo-shuttle` and it should install in no time.
So let's open up that Cargo.toml and add the required dependencies - we'll add `axum` and `shuttle-axum` to build the server, `tokio` for async work and the `shuttle-runtime` to run in Shuttle's cloud.
```
axum = "0.7.3"
shuttle-axum = "0.44.0"
shuttle-runtime = "0.44.0"
tokio = "1.28.2"
```
Now, pop open the main.rs and let's create a simple server we can deploy to Shuttle:
```rust
async fn main() -> shuttle_axum::ShuttleAxum {
let router = Router::new();
Ok(router.into())
}
```
Yes, that's really everything you need to start & deploy a server - quite amazing, isn't it?
Now, let's add to the router an endpoint that will wrap it all together. We'll keep it simple, passing in the video ID through the path itself - so you can replace the `youtube.com/watch?v=VIDEO_ID` url with just `ourservice.com/VIDEO_ID`, keeping the API simple and concise. With Axum, adding endpoints is super easy - we just define the endpoint path and write the function. For this one, we'll use a `GET /:video_id`and pass it in the video ID in the path itself.
So let's add a function that will get this path and invoke our `summarize_video`:
```rust
async fn summarize_endpoint(Path(video): Path) -> String {
let summary = summarize_video(video.as_str()).await;
return summary;
}
```
And add it to our Axum configuration:
```rust
#[shuttle_runtime::main]
async fn main() -> shuttle_axum::ShuttleAxum {
let router = Router::new().route("/:video", get(summarize_endpoint));
Ok(router.into())
}
```
With this we can finally deploy - just hit `cargo shuttle project start && cargo shuttle deploy --ad`, grab a coffee and you'll find your agents spinning in Shuttle's cloud, ready to be used. So let's test it out - we'll use the [Shuttle AI announcement video](https://www.youtube.com/watch?v=6sHo-2ddw3U) as an example. For now, we'll keep it simple and just use curl - later, you can also build a frontend for it, using something like [Next.js](https://www.shuttle.dev/blog/2023/03/23/nextjs-and-rust) or [one of Shuttle's starter templates](https://docs.shuttle.dev/templates/overview).
So let's bring up your terminal and curl it:
`curl "yourprojectname.shuttleapp.rs/6sHo-2ddw3U"`
If you've done everything right, you should receive back the summary and key points as a JSON - if you see something about Chateau instead of Shuttle, don't worry, nothing's broken - except Youtube's auto-caption service. Maybe they should rewrite it in Rust? :)
But now that you're done, give yourself a high-five - you deserved it - then go build that frontend.
And feel free to [share it with us on Discord](https://discord.com/invite/shuttle) - we're eager to see what you'll build!
---
# Building your first AI tool in Rust
Source: https://www.shuttle.dev/blog/2024/04/29/building-your-first-ai-tool-rust
Date: 29 April 2024
Author: ivan
Tags: rust, ai, guide
Writing a simple AI helper with Rust using llm-chain
In this tutorial, we'll build a command-line application in Rust that can analyze data from a CSV file. The app will prompt the user to enter a question, and it will provide an answer based on the data in the CSV file.
At the end, we'll be able to ask our helper various questions, and get various answers! Here's a short video that shows its powers:
The full code of the Rust AI helper can be found [here.](https://github.com/joshua-mo-143/shuttle-blog-tutorials/tree/main/shuttle-first-ai-tool)
## Prerequisites
Before we get started, make sure you have the following installed:
- Rust (you can install it from [rustup.rs](https://rustup.rs))
- The `csv` and `llm_chain` crates (we'll install these later)
You'll also need an OpenAI API key which you can [get here](https://platform.openai.com/api-keys).
## Setting up the Project
First, create a new Rust project:
```bash
cargo new data-analysis-app
cd data-analysis-app
```
Next, open the `Cargo.toml` file and add the required dependencies:
```toml
[dependencies]
csv = "1.1"
llm-chain = "0.13.0"
llm-chain-openai = "0.13.0"
tokio = { version = "1.25.0", features = ["macros", "rt-multi-thread"] }
```
These lines add the required dependencies for our project: `csv` for reading CSV files, [`llm_chain`](https://github.com/sobelio/llm-chain) for natural language processing, and [`tokio`](https://tokio.rs) for async runtime functionality. We also use `llm-chain-openai` (for integration with the OpenAI API).
## What is llm-chain?
Here is the description from their [official GitHub repository](https://github.com/sobelio/llm-chain):
> llm-chain is a collection of Rust crates designed to help you create advanced LLM applications such as chatbots, agents, and more.
`llm-chain` is effectively an LLM orchestration library that allows you to "chain" prompts together, executing one after the other - with extra features:
- Templates are supported, allowing you to not need to manually chain steps
- We can carry out complex tasks that LLMs cannot handle in a single step
- `llm-chain` also supports vector storage, allowing long term memory and subject matter knowledge.
This benefits us in several ways:
- Being able to chain steps allows us to get much closer to a useful output, rather than only being able to use one step. For example, you may want several pre-instruction prompts to set up a context for your application.
- By operating on data in steps, we can get much better insight from our data.
LLM orchestration is a crucial tool for enterprise AI, as business use cases often require advanced contexts.
## Diving into it
Let's update our `main.rs` file by importing all the neccessary crates we will need. I've added comments to the snippet below that describe what each crate/module is used for.
```rust
use std::env;
use std::error::Error;
use std::fs::File;
use std::io::{self, Write};
use csv::Reader;
use llm_chain::{executor, parameters, prompt, step::Step};
```
Next, we will mark our `main` function with the `async` keyword and add the `#[tokio::main]` macro right on-top of it. This allows us to use the Tokio asynchronous runtime for async functionality and automatic polling of futures (values that have may or may not finished work).
P.S. If you'd like to learn more about Async in Rust, you can check out our [Async Rust in a Nutshell](https://www.shuttle.dev/blog/2024/02/29/async-rust) article!
```rust
#[tokio::main]
async fn main() -> Result<(), Box> {
// ...
}
```
The return type is set to `Result<(), Box>` to enable error propagation with `?` and overall error handling across different error types.
### Adding our API Key
Find your API key from OpenAI and add it to your current shell session's environment variables:
`export OPENAI_API_KEY=your_api_key_here`
Make sure to replace `your_api_key_here` with your actual API key which you can [get here](https://platform.openai.com/api-keys).
Now when we use our program, we won't have to worry about storing our environment variable anywhere in the program!
### Creating an Executor
We create an executor instance using the `executor!` macro from the `llm_chain` crate. The macro makes it easy for us to create a new executor for a specific model without having to directly call the constructor functions of the respective executor structs. In short; it allows you to call an LLM with a pre-defined input and output, using multiple steps to refine the output.
```rust
let exec = executor!()?;
```
### Reading the CSV file
For this example, we'll be reading data from a CSV file because we are building a data-helper tool which will allows us to ask it various questions regarding the data at-hand.
The snippet below opens a CSV file named "data.csv" in the root folder and reads its contents into a string variable `csv_data`, where each row is represented as a comma-separated string with a newline character at the end. It also uses the `csv` crate to handle the CSV parsing. In short, it makes sure that we can the `csv` data for further actions.
```rust
let file = File::open("data.csv")?;
let mut reader = Reader::from_reader(file);
let mut csv_data = String::new();
for result in reader.records() {
let record = result?;
csv_data.push_str(&record.iter().collect::>().join(","));
csv_data.push('\n');
}
```
The contents of the CSV file (make sure to create a `data.csv` file in your root directory and copy-paste the contents below):
```csv
Name,Age,Occupation,City,FavoriteSport,AnnualIncome
Samantha,28,Entrepreneur,New York,Skydiving,$120000
Michael,35,Software Engineer,San Francisco,Rock Climbing,$95000
Emily,42,Chef,Chicago,Surfing,$65000
David,25,Artist,Los Angeles,Parkour,$30000
Sophia,31,Pilot,Miami,Bungee Jumping,$85000
Daniel,47,Doctor,Boston,Snowboarding,$180000
Olivia,22,Student,Seattle,Skateboarding,$12000
William,39,Marketing Manager,Austin,Mountain Biking,$110000
Ava,27,Photographer,Portland,Kayaking,$45000
Jacob,33,Teacher,Denver,Hiking,$55000
Isabella,40,Lawyer,Washington D.C.,Scuba Diving,$200000
Ethan,29,Musician,Nashville,Bouldering,$25000
Mia,36,Graphic Designer,Atlanta,Skiing,$75000
Benjamin,44,Engineer,Houston,Surfing,$125000
Abigail,23,Writer,Minneapolis,Rock Climbing,$18000
```
Example of what it looks like as a table:
| Name | Age | Occupation | City | FavoriteSport | AnnualIncome |
| -------- | --- | ----------------- | ------------- | ------------- | ------------ |
| Samantha | 28 | Entrepreneur | New York | Skydiving | $120000 |
| Michael | 35 | Software Engineer | San Francisco | Rock Climbing | $95000 |
| Emily | 42 | Chef | Chicago | Surfing | $65000 |
| David | 25 | Artist | Los Angeles | Parkour | $30000 |
### Creating the user input loop
The user input loop is the loop which the user uses to continuosly ask questions to our helper. The next couple of sections are all happening within this loop -- prompting, executing, outputting the result, etcetera.
To start thing off; we'll be asking the user to enter their question and when the user is done with asking questions, they can type in `quit` to exit the helper.
```rust
loop {
println!("Enter your prompt (or 'quit' to exit):");
io::stdout().flush()?;
let mut user_prompt = String::new();
io::stdin().read_line(&mut user_prompt)?;
user_prompt = user_prompt.trim().to_string();
if user_prompt.to_lowercase() == "quit" {
break;
}
// ...
}
```
### Setting the prompt
Now, we'll create a prompt string that includes the user's question and the CSV data. This prompt will be used by the `llm_chain` crate to generate a response.
> 💡 **TIP**: When defining prompts, be clear and concise about the task you want the language model to perform. Provide any necessary context or input data (like the CSV example) and be specific about the desired output (eg, a summary, analysis, code, or text generation).
```rust
let prompt_string = format!(
"You are a data analyst tasked with analyzing a CSV file containing information about individuals, including their name, age, occupation, city, favorite sport, and annual income. Your goal is to provide clear and concise answers to the given questions based on the data provided.
Question: {}\n\nCSV Data:\n{}",
user_prompt, csv_data
);
```
### Creating a Step instance
We create a Step instance from the `llm_chain` crate, passing in the prompt string we created earlier.
Steps are individual LLM invocations in a chain. They are a combination of a prompt and a configuration and we use them to set the per-invocation setting for a prompt. This comes in very handy when we want to change the settings for a specific prompt in a chain.
```rust
let step = Step::for_prompt_template(prompt!("{}", &prompt_string));
```
### Connecting everything together
We run the analysis by calling the `run` method on the `Step` instance, passing in the parameters and the executor we created earlier.
```rust
let res = step.run(¶meters!(), &exec).await?;
```
### Outputting the result
This one is as simple as it gets; we invoke the `println!()` macro print the result of the analysis to the console.
```rust
println!("{}", res.to_immediate().await?.as_content());
```
That's the end of our loop and now we need to wrap it all up by adding `Ok(())` at the end of the main function to indicate that the function executed successfully without any errors.
### Running our App
To run the app, navigate to the project directory and execute `cargo run`. You should see the following message in your terminal:
```bash
Enter your prompt (or 'quit'` to exit):
```
Enter your question related to the data in the data2.csv file, and the app will provide a concise answer based on the analysis.
Here are some CSV-specific questions you can ask your helper:
1. "Who has the highest annual income, and what is their occupation?"
2. "What is the most popular extreme sport among the individuals in the data?"
3. "Which city has the most individuals represented in the data?"
4. "What is the average age of the individuals whose favorite sport is rock climbing?"
5. "Which occupation has the highest average annual income?"
### Challenge
Sharing a CLI app with your friends or team mates might not be too straight-forward.
As a challenge, try building an API around your helper with endpoints that'll allow users to interact with it.
Next, build a simple frontend with a small prompt box that users can use to ask your helper various questions, it should communicate with your API.
And finally, hook it all up together and try deploying it with Shuttle!
P.S. Tweet `#shuttleai` when you are done and we'll check out and share your creations!
## Summary
In this tutorial, we built a command-line application in Rust that can analyze data from a CSV file. The app uses the `csv` and `llm_chain` crates to read the CSV data and generate a response based on the user's question.
If you are up for another challenge; try making the data source dynamic, allowing users to upload their own `csv`, or even better, other file formats such as `pdf` or `json`!
Read more:
- [Creating a RAG-assisted web service with Axum](https://www.shuttle.dev/blog/2024/02/28/rag-llm-rust)
- [More than you've ever wanted to know about error handling](https://www.shuttle.dev/blog/2022/06/30/error-handling)
---
# Event driven Microservices using Kafka and Rust
Source: https://www.shuttle.dev/blog/2024/04/25/event-driven-services-using-kafka-rust
Date: 25 April 2024
Author: josh
Tags: rust, kafka, guide
Building an event-driven microservice using Apache Kafka and Rust
When it comes to real-time data handling, there are certain challenges that are imposed upon regular HTTP-based services. Resiliency, consistency and reliability are all qualities that a production-grade system handling real-time data processing should have. Event driven architecture and microservices is one way to become more resilient against this kind of issue. In this post, we'll take a deep dive into writing an event driven microservice and how we can use Change Data Capture to assist with taking functionality from a monolith and putting it in a microservice.
Interested in deploying or got stuck somewhere in the article? You can find the final repository [here.](https://github.com/joshua-mo-143/kafka-shuttle)
## What does "event-driven" mean?
The term "event-driven" simply means that the web service is not driven by HTTP requests, but consumes events from event sources and executes logic based on the event type. This is in contrast to HTTP request based interactions. In practicality, events may be driven by a message queue (like AMQP) or event store like Kafka where messages are sent and received by one or more services.
Event-driven microservices are often used as part of an event-driven architecture, where the whole system is based on passing of published messages and using them as a source of truth. The advantages of event-driven architecture are clear:
- Ideal for handling real time data in large quantities
- Because event driven services don't rely on synchronous HTTP calls, instead using events, there is less chance of a cascading failure across your architecture if something fails.
- Using a message broker promotes loose component coupling, meaning you are not required to know the specific implementation of how your component works with other components.
Of course, with advantages there are also new challenges that need to be overcome:
- How do you deal with out-of-order messages?
- How do you migrate functionality from a monolith to an event-driven microservice?
- How do you test that your system actually works?
We'll be diving into all this and more in this article!
## Getting started
### Pre-requisites
If you want to connect locally to a Kafka instance, you'll either need Apache Kafka and Zookeeper with both running, or Docker installed so that you can spin up Kafka and Zookeeper instances..
If you want to deploy this service to the web somewhere, you'll also want to make use of a service that provides Kafka. Shuttle currently doesn't provide it, but you can make use of services like Upstash to be able to provide it. You'll need to store your environment variables in the `Secrets.toml` file as described later on.
### Project setup
To get started, we'll want to make a new project using `shuttle init` - don't forget to select Axum as the framework! You will need `cargo-shuttle` installed for this. If you don't have it installed, you can use `cargo install cargo-shuttle`.
We'll then want to use the following shell snippet to install our project dependencies:
```rust
cargo add serde@1.0.198 -F derive
cargo add serde-json@1.0.116
cargo add shuttle-service
cargo add shuttle-shared-db -F postgres,sqlx
cargo add sqlx -F runtime-tokio-rustls,postgres,macros
cargo add thiserror@1.0.59
cargo add rdkafka@0.36.2 -F cmake-build
cargo add futures@0.3.30
cargo add pretty_env_logger@0.5.0 --dev
cargo add testcontainers@0.15.0 --dev
cargo add testcontainers-modules@0.3.7 --dev -F kafka
```
Then we'll add our macro annotations to our application:
```rust
#[shuttle_runtime::main]
async fn main(
#[shuttle_shared_db::Postgres] db: PgPool,
#[shuttle_runtime::Secrets] secrets: SecretStore,
) -> shuttle_axum::ShuttleAxum {
// your function code here
}
```
With only three lines, we've added a database (provisioned locally by Docker and provisioned by Shuttle servers in deployment!), our Secrets file and deployment metadata to the application!
We will also be using `sqlx` to handle our database migrations and queries. This means we'll also want to use `sqlx-cli` to help manage our migrations. We'll get started by installing it (the following command adds all features):
```rust
cargo install sqlx-cli
```
Next, you can use `sqlx migrate add init` to generate a new migration file located in the `migrations` folder (a subfolder of your root project). We'll generate a simple table:
```sql
-- Add migration script here
create table if not exists messages (
message_id int primary key,
name varchar not null,
message varchar not null,
last_updated date not null default current_date
);
```
We'll be expanding on this later, but for the basics this is all we need.
We'll also be making use of SQLx's macros to enable type-checked queries. For this, we'll need to spin up a database, use `sqlx migrate run` to run the migrations against the database then use `cargo sqlx prepare` to generate our `.sqlx` folder. Once this folder gets checked into version control, we won't need a database anymore when compiling our query macros.
Here's a shell snippet you can use to accomplish this quickly (requires Docker to be running):
```rust
docker run -d -t -p 8081:5432 --name kafka-shuttle-pg postgres
sqlx migrate run --database-url postgres://postgres:postgres@localhost:8081/postgres
DATABASE_URL=postgres://postgres:postgres@localhost:8081/postgres cargo sqlx prepare
docker rm -f kafka-shuttle-pg
```
You'll want to make sure to keep your Kafka endpoint URL somewhere, as we'll be putting this in a `Secrets.toml` file:
```rust
KAFKA_URL = ""
```
Because we're deploying via Shuttle, we will be using Secrets rather than raw environment variables. When storing our environment variables later, you'll want to iterate through the `SecretStore` type like in the snippet below:
```rust
secret_store.into_iter().for_each(|x| std::env::set_var(x.0, x.1));
```
When you deploy or run locally, the secrets will get taken from this file.
### Set up Kafka using Docker
A simple Kafka setup can easily be done using Docker Compose:
```yaml
# docker-compose.yml
version: "3"
services:
# kafka
zookeeper-1:
container_name: zookeeper-1
image: zookeeper
restart: always
ports:
- 2181:2181
environment:
- ZOOKEEPER_CLIENT_PORT=2181
volumes:
- ./config/zookeeper-1/zookeeper.properties:/kafka/config/zookeeper.properties
kafka-1:
container_name: kafka-1
image: bitnami/kafka
restart: on-failure
depends_on:
- zookeeper-1
ports:
- 9092:9092
environment:
- KAFKA_ZOOKEEPER_CONNECT=zookeeper-1:2181
- KAFKA_ADVERTISED_LISTENERS=PLAINTEXT://localhost:9092
- ALLOW_PLAINTEXT_LISTENER=yes
- KAFKA_CFG_LISTENER_SECURITY_PROTOCOL_MAP=CONTROLLER:PLAINTEXT,PLAINTEXT:PLAINTEXT
- KAFKA_AUTO_CREATE_TOPICS_ENABLE=true
- KAFKA_CREATE_TOPICS=messages:1:3
healthcheck:
test:
["CMD-SHELL", "kafka-topics.sh --bootstrap-server kafka:9092 --list"]
interval: 5s
timeout: 10s
retries: 5
networks:
net:
name: "net"
driver: bridge
```
If you run this `docker-compose.yml` setup, it should automatically spawn a Zookeeper and Kafka instance for you. There are a lot of initial logs created when spawning both instances, so you may want to either create a detached instance (using `-d` flag) or opening a separate terminal window for this.
You may find on startup that the topic is not initialised properly, in which case you can use this shell snippet to auto-create a topic in the Docker container:
```bash
#!/usr/bin/env sh
docker exec kafka-1 /opt/bitnami/kafka/bin/kafka-topics.sh \
--bootstrap-server localhost:9092 --create --if-not-exists --topic messages \
--replication-factor 1 --partitions 1
```
## Building
### Error Handling
Before we get started, we should think about the kinds of errors we can get from using our application. There are a few that immediately come to mind:
- An RDKafka error
- An error from using Kafka itself
- `serde_json` errors (particularly when serializing and deserializing messages)
- Oneshot messages being cancelled (from `futures::channel`)
We can represent all of these errors using an enum that uses the `thiserror` crate to easily derive error messages:
```rust
#[derive(Debug, thiserror::Error)]
pub enum ApiError {
#[error("RDKafka error: {0}")]
RDKafka(#[from] rdkafka::error::RDKafkaError),
#[error("Kafka error: {0}")]
Kafka(rdkafka::error::KafkaError),
#[error("De/serialization error: {0}")]
SerdeJson(#[from] serde_json::Error),
#[error("Oneshot message was canceled")]
CanceledMessage(#[from] futures::channel::oneshot::Canceled),
}
```
Note that while three of our types use the `#[from]` attribute macro to quickly derive the `From` implementation, converting a `KafkaError` into our enum variant is a little bit more tricky. The methods that return this error will normally return the error as a tuple containing both the error and the record where the error occurred. We can thus implement it like this:
```rust
impl<'a>
From<(
rdkafka::error::KafkaError,
rdkafka::producer::FutureRecord<'a, str, std::vec::Vec>,
)> for ApiError
{
fn from(
e: (
rdkafka::error::KafkaError,
rdkafka::producer::FutureRecord<'a, str, std::vec::Vec>,
),
) -> Self {
Self::Kafka(e.0)
}
}
impl From<(rdkafka::error::KafkaError, rdkafka::message::OwnedMessage)> for ApiError {
fn from(e: (rdkafka::error::KafkaError, rdkafka::message::OwnedMessage)) -> Self {
Self::Kafka(e.0)
}
}
```
To use this error type with our Axum service, we need to implement the `IntoResponse` trait. This trait specifically represents a type that can be turned into a HTTP response. We can do so by pattern matching the enum like so:
```rust
impl IntoResponse for ApiError {
fn into_response(self) -> Response {
let (status, body) = match self {
Self::Kafka(e) => (StatusCode::INTERNAL_SERVER_ERROR, e.to_string()),
Self::RDKafka(e) => (StatusCode::INTERNAL_SERVER_ERROR, e.to_string()),
Self::SerdeJson(e) => (StatusCode::BAD_REQUEST, e.to_string()),
Self::CanceledMessage(e) => (StatusCode::BAD_REQUEST, e.to_string()),
};
(status, body).into_response()
}
}
```
### Setting up a producer and consumer
To get started with `rdkafka`, we need to create a publisher and a consumer. We can do this with these two functions:
```rust
pub fn create_kafka_producer(secrets: &SecretStore) -> FutureProducer {
let url = secrets.get("KAFKA_URL").unwrap();
let log_level: FutureProducer = ClientConfig::new()
.set("bootstrap.servers", url)
.set("message.timeout.ms", "5000")
.set("allow.auto.create.topics", "true")
.create()
.expect("Producer creation error");
log_level
}
pub fn create_kafka_consumer(secrets: &SecretStore) -> StreamConsumer {
let url = secrets.get("KAFKA_URL").unwrap();
ClientConfig::new()
.set("group.id", "shuttle-kafka")
.set("bootstrap.servers", url)
.set("enable.partition.eof", "false")
.set("session.timeout.ms", "6000")
.set("enable.auto.commit", "true")
// only store offset from the consumer
.set("enable.auto.offset.store", "false")
.set_log_level(RDKafkaLogLevel::Debug)
.create()
.expect("Consumer creation failed")
}
```
These settings may be changed according to your liking. You can find a full list of configuration properties [here.](https://github.com/confluentinc/librdkafka/blob/master/CONFIGURATION.md)
You may note that above, we've enabled auto commit while only enabling storing offset from the consumer. The reason for this is that it allows us to rely on the underlying Kafka logic to commit regularly while only allowing the consumer to commit a message after it's been fully processed. This enables us to prevent any loss of messages! This is also called **At Least Once** delivery.
Note that the producer has permissions to automatically create topics. In production, you may want to remove this and create topics manually. Allowing a producer to create topics freely may result in some unexpected behaviour!
Additionally, some hosted Kafka services will require SASL or SSL authentication. You can find more about the dependencies in the `rdkafka-rust` repo [here.](https://github.com/fede1024/rust-rdkafka?tab=readme-ov-file#installation) Note that if you are unable to install dependencies, `rdkafka` also has feature flags for vendored versions of the required dependencies.
Next, we'll want to create our `AppState` which will hold the `FutureProducer` created by the `create_kafka_producer` function:
```rust
// src/state.rs
use crate::kafka;
use rdkafka::producer::FutureProducer;
use shuttle_runtime::SecretStore;
use shuttle_service::Environment;
#[derive(Clone)]
pub struct AppState {
kafka_producer: FutureProducer,
}
impl AppState {
pub fn new(secrets: &SecretStore) -> Self {
let kafka_producer = kafka::create_kafka_producer(secrets),
Self { kafka_producer }
}
}
impl<'a> AppState {
pub fn producer(&'a self) -> &'a FutureProducer {
&self.kafka_producer
}
}
```
To tie this all together, we'll add it to our main function:
```rust
#[shuttle_runtime::main]
async fn main(
#[shuttle_shared_db::Postgres] db: PgPool,
#[shuttle_runtime::Secrets] secrets: SecretStore,
) -> shuttle_axum::ShuttleAxum {
sqlx::migrate!().run(&db).await.unwrap();
let state = AppState::new(&secrets);
let rtr = Router::new().route("/", get(hello_world)).with_state(state);
Ok(rtr.into())
}
```
### Using a Kafka producer
To use our producer, we'll first need something to send. Let's create a simple struct that will have an action, as well as a message ID, name and the message itself:
```rust
use serde::{Deserialize, Serialize};
#[derive(Debug, Serialize, Deserialize)]
struct CustomMessage {
name: String,
message: String,
}
#[derive(Debug, Serialize, Deserialize)]
pub struct KafkaMessage {
action: Action,
message_id: i32,
data: Option,
}
#[derive(Debug, Serialize, Deserialize)]
enum Action {
Create,
Update,
Delete,
}
```
Here we have modeled a message that can take three different forms: A create action, an update action and a delete action. The `data` field has been left as an `Option`, as with the `Delete` action there is no data required. We can then use these in a new Axum handler function endpoint like so:
```rust
async fn send_message(
State(state): State,
Json(message): Json,
) -> Result<&'static str, ApiError> {
let msg = serde_json::to_vec(&message)?;
let record: FutureRecord